
Marrying Vega and Zen: The AMD Ryzen 5 2400G Review
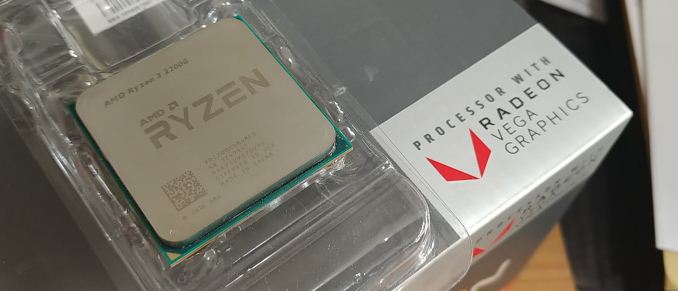
AMD's new launch of APUs hits the apex of the 2017 designs that tend the balance sheet black. After a return to high performance on x86 with the Ryzen CPU product line, and the 'we can't product enough' Vega graphics, AMD has inserted several product lines that combine the two. Today is the launch of the desktop socket edition APUs, with four Zen cores and up to 11 Vega compute units. AMD has historically been aggressive in the low-end desktop space, effectively killing the sub-$100 discrete graphics market. The new APUs now set the bar even higher. In this review we focus on the Ryzen 5 2400G, but also test the Ryzen 3 2200G.
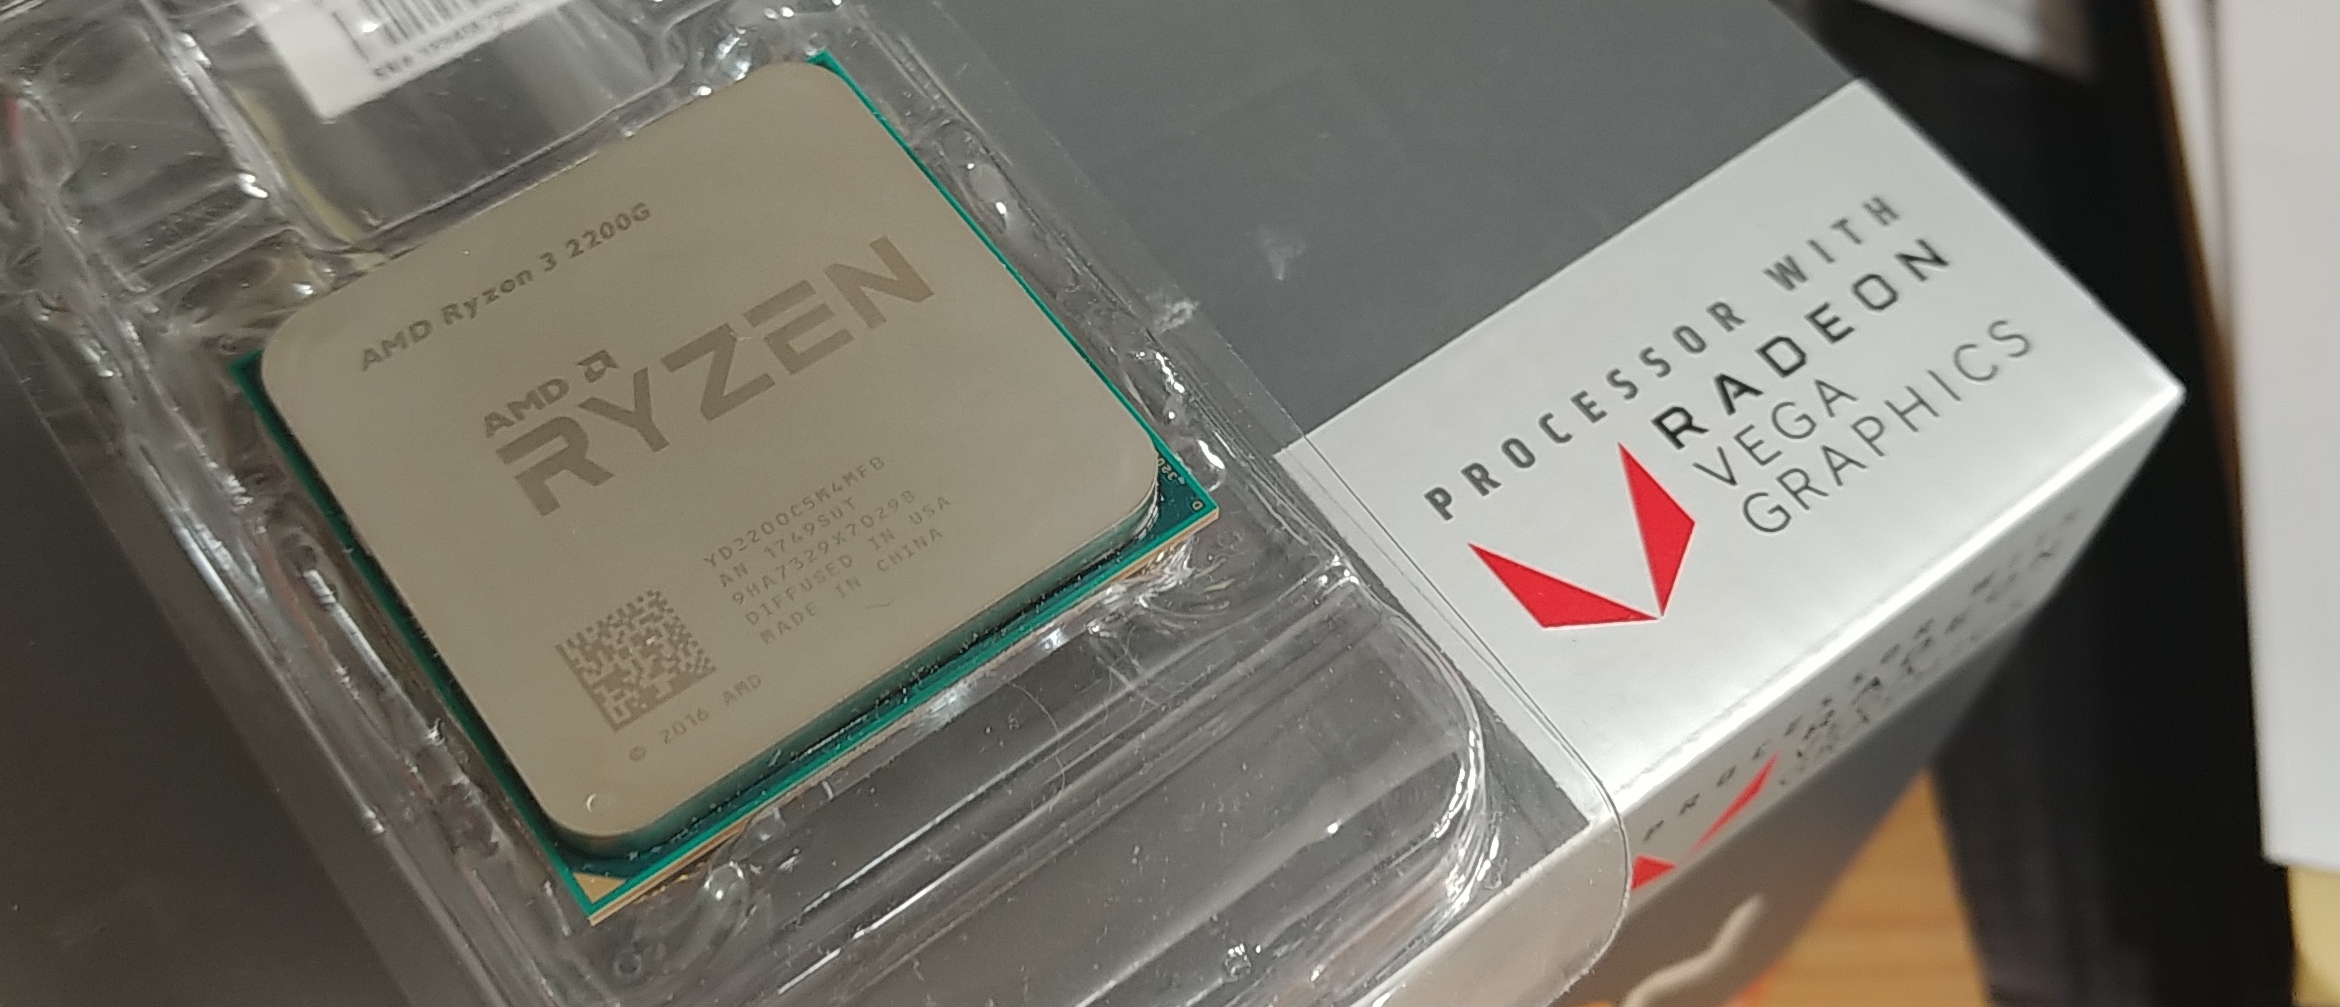
The two APUs that AMD is launching today are the Ryzen 5 2400G, a $169 14nm quad-core Zen processor with simultaneous multithreading and ‘Vega 11’ graphics, and the Ryzen 3 2200G, a $99 14nm quad-core Zen processor without simultaneous multithreading and with ‘Vega 8’ graphics. Both parts are distinguishable from the non-integrated graphics Ryzen processors with the ‘G’, which is similar to how Intel is marketing its own Vega-enabled processors.
| AMD Ryzen 2000-Series APUs | ||
| Ryzen 5 2400G with Vega 11 | Ryzen 3 2200G with Vega 8 | |
| CPU Cores/Threads | 4 / 8 | 4 / 4 |
| Base CPU Frequency | 3.6 GHz | 3.5 GHz |
| Turbo CPU Frequency | 3.9 GHz | 3.7 GHz |
| TDP @ Base Frequency | 65 W | 65 W |
| Configurable TDP | 46-65 W | 46-65 W |
| L2 Cache | 512 KB/core | 512 KB/core |
| L3 Cache | 4 MB | 4 MB |
| Graphics | Vega 11 | Vega 8 |
| Compute Units | 11 CUs | 8 CUs |
| Streaming Processors | 704 SPs | 512 SPs |
| Base GPU Frequency | 1250 MHz | 1100 MHz |
| DRAM Support | DDR4-2933 Dual Channel | DDR4-2933 Dual Channel |
| OPN PIB | YD2400C4FBBOX | YD2200C5FBBOX |
| OPN Tray | YD2400C5M4MFB | YD2200C4M4MFB |
| Price | $169 | $99 |
| Bundled Cooler | AMD Wraith Stealth | AMD Wraith Stealth |
Most of the following analysis in this section was taken from our initial APU Ryzen article.
Despite the Ryzen 5 2400G being classified as a ‘Ryzen 5’, the specifications of the chip are pretty much the peak specifications that the silicon is expected to offer. AMD has stated that at this time no Ryzen 7 equivalent is planned. The Ryzen 5 2400G has a full complement of four cores with simultaneous multi-threading, and a full set of 11 compute units on the integrated graphics. This is one compute unit more than the Ryzen 7 2700U Mobile processor, which only has 10 compute units but is limited to 15W TDP. The 11 compute units for the 2400G translates as 704 streaming processors, compared to 640 SPs on the Ryzen 7 2700U or 512 SPs on previous generation desktop APUs: an effective automatic 25% increase from generation to generation of desktop APU without factoring the Vega architecture or the frequency improvements.
The integrated graphics frequency will default to 1250 MHz and the total chip TDP is 65W. Maximum supported memory frequency will vary depending on how much memory is used and what type, but AMD lists DDR4-2933 as the support for one single-sided module per channel. Aside from the full set of hardware, the CPU frequency of the 2400G is very high, similar to the standard Ryzen 7 desktop processors: a base frequency of 3.6 GHz and a turbo of 3.9 GHz will leave little room for overclocking. (Yes, that means these chips are overclockable.)
The Ryzen 5 2400G somewhat replaces the Ryzen 5 1400 at the $169 price point. Both chips will continue to be sold, but at this price point AMD will be promoting the 2400G over the 1400. The 2400G has a higher set of frequencies (3.6G vs 3.2G base frequency, 3.9G vs 3.4G turbo frequency), higher memory support (DDR4-2933 vs DDR4-2666), no cross-CCX latency between sets of cores, but has less L3 cache per core (1 MB vs 2 MB). In virtually all scenarios, even if a user does not use the Ryzen 5 2400G integrated graphics, the Ryzen 5 2400G seems the better option on paper.
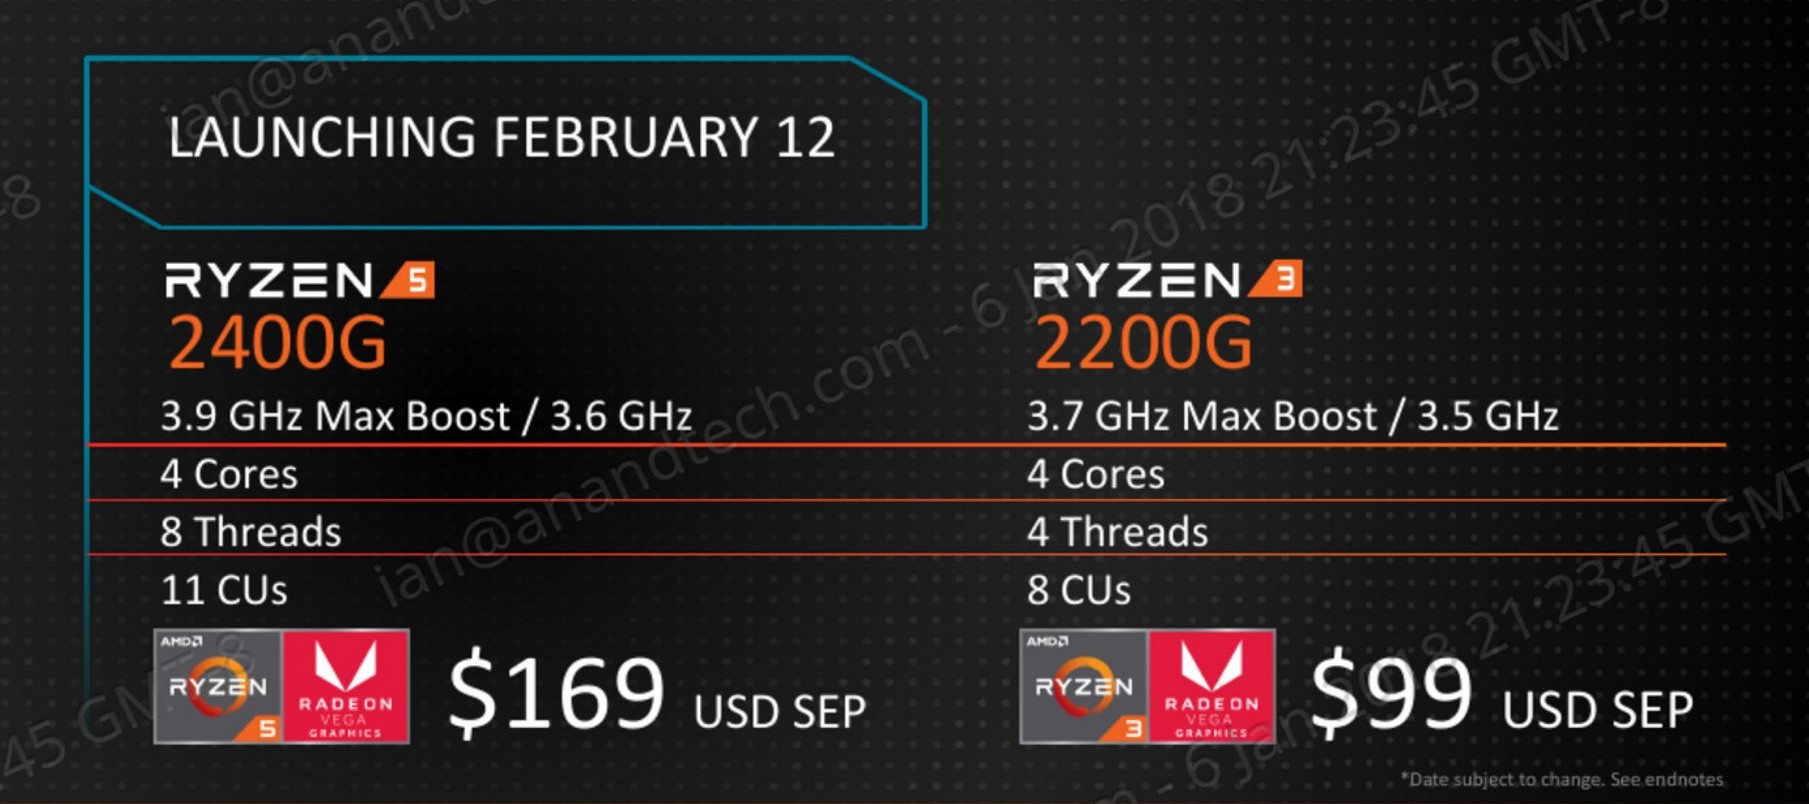
The cheaper $99 processor is the Ryzen 3 2200G. The specifications follow the other Ryzen 3 processors already in the market: four cores, and no simultaneous multi-threading. The rated frequencies, 3.5 GHz for base and 3.7 GHz for turbo, are slightly below that of the Ryzen 5 2400G but are still reasonably high – despite this chip being rated for 65W, the same as the Ryzen 5 2400G, users might expect this processor to turbo for longer within its power window as long as it is within its thermal boundaries (we do see this in some benchmarks in the review). The suggested retail price of $99 means that this is the cheapest Ryzen desktop processor on the market, and it crosses a fantastic line for consumers: four high-performance x86 cores under the $100 mark. The integrated graphics provide 512 streaming processors, identical to the $169 processors from previous generations, but this time upgraded with the Vega architecture.
Within the presentations at Tech Day, AMD typically provides plenty of performance data from their own labs. Of course, we prefer to present our own data obtained in our labs, but combing through AMD’s numbers provided a poignant point as to just how confident AMD is on even its low end unit: using the 3DMark 11 Performance benchmark, the Ryzen 3 2200G (according to AMD) scored 3366 points, while on the same benchmark Intel’s best integrated graphics offering, the Core i7-5775C with embedded DRAM, scored only 3094. If we took this data point as the be-all and end-all, it would come across that AMD has broken Intel’s integrated graphics strategy. We have some other interesting numbers in today’s review.
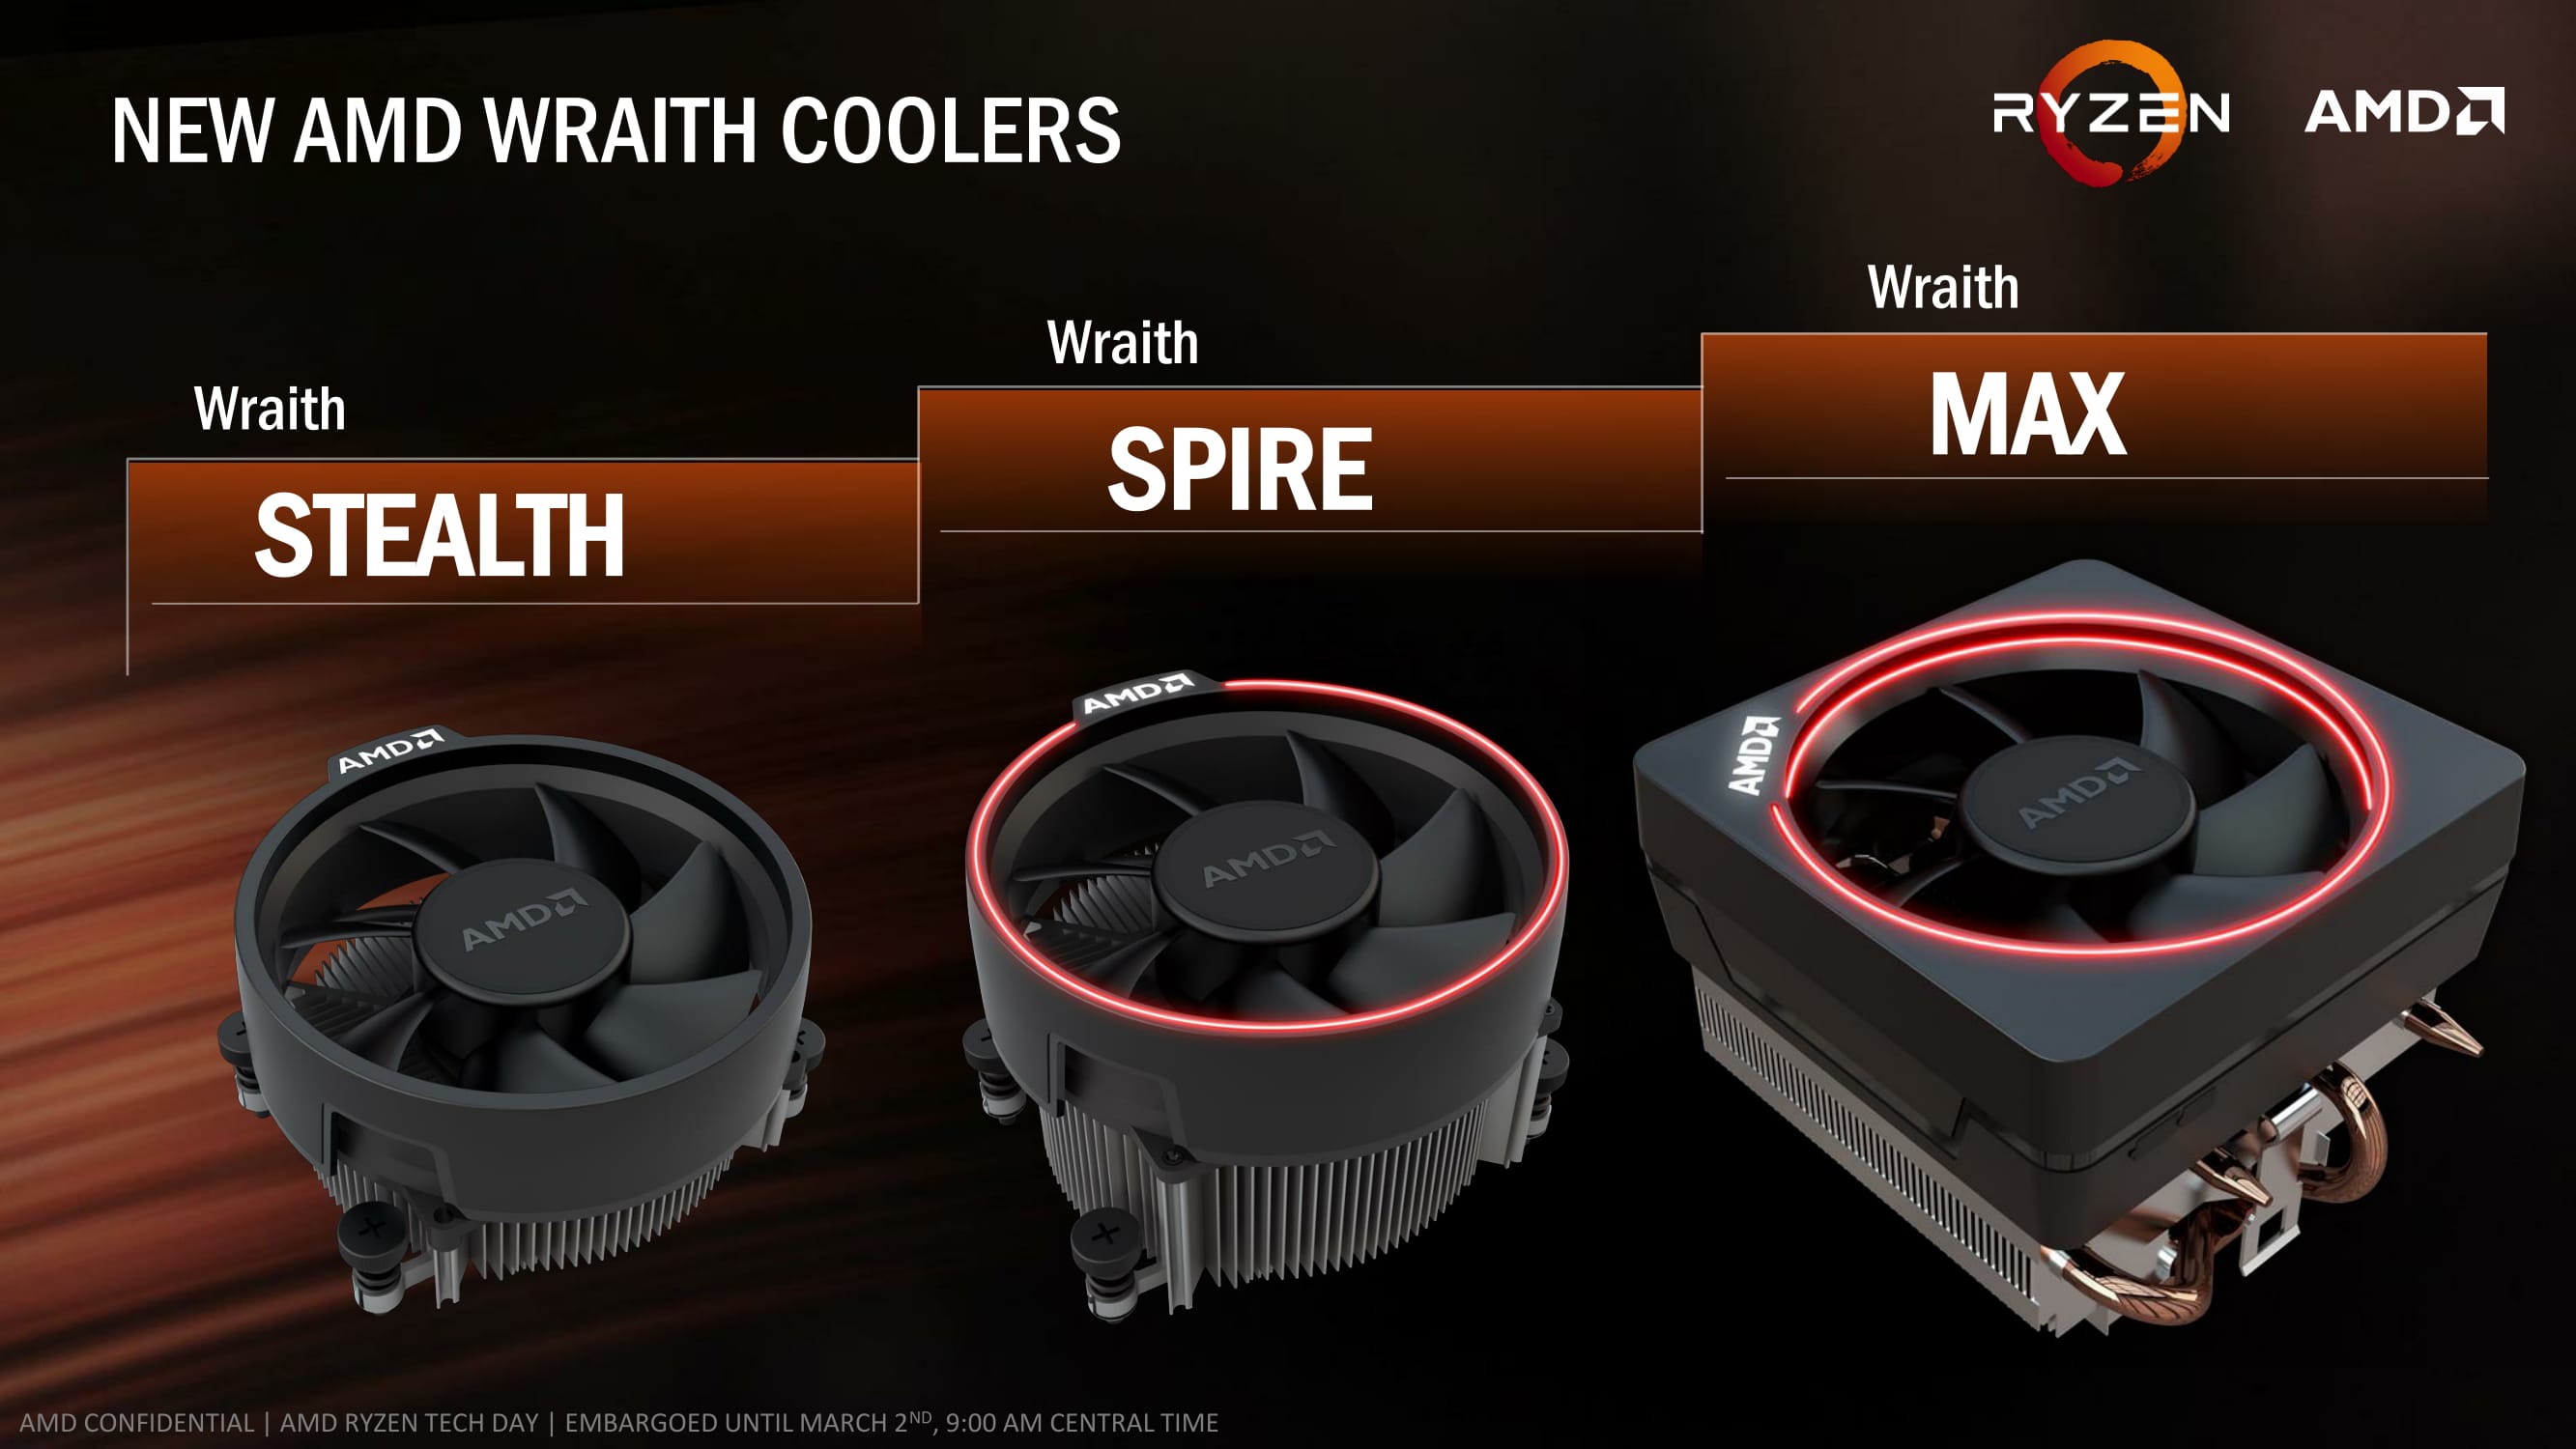
One of the other important elements to the Ryzen APU launch is that both processors, including the Ryzen 3 2200G for $99, will be bundled with AMD’s revamped Wraith Stealth (non-RGB) 65W cooler. This isn’t the high-end AMD cooler, but as far as stock coolers go, it easily introduces a $30 saving to any PC build, reducing the need to buy a hefty standard cooler.
Over the last 10 years, joining a CPU and a GPU together, either as two bits of silicon in a package or both on the same bit of silicon, fit a hole that boosted the low end market. It completely cut the need for a discrete graphics card if all a user needed was a basic desktop experience. This also had a knock on effect for mobile devices, reducing the total power requirements even under light workload scenarios. Since then, however, the integrated graphics has been continually asked to do more. Aside from 2D layering, we are now asking it to deal with interactive webpages, new graphics APIs, and new video decode formats. The march to higher resolution displays means new complex ways of encoding video information have been developed to minimize file size but keep the quality, which can stretch a basic integrated graphics solution, resulting in dedicated decode hardware to be added to future versions of the hardware.
The Sisyphean task, the Holy Grail for graphics, has always been gaming. Higher fidelity, higher resolutions, and more immerse environments like virtual reality, are well beyond the purview of integrated graphics. For the most part, the complex tasks still are today - don't let me fool you on this. But AMD did set to change the status quo when it introduced its later VLIW designs, followed by its GCN graphics architecture, several generations ago. The argument at the time was that most users were budget limited, and by saving money on a decent integrated graphics solution, the low-end gamer could get a much better experience. This did seem odd at the time, given AMD's success in the low-end discrete graphics market - they were cannibalizing sales of one product for another with a more complex design and lower margins. This was clearly apparent during our review analysis at the time.
Over several years of Bulldozer processing cores and integrated graphics designs, AMD competed on two main premises: performance per dollar, and peak performance. In this market the competition was Intel, with its 'Gen' graphics design. Both companies made big strides in graphics, however a bifurcation soon started to develop: Intel's Gen graphics were easily sufficient for office work in mobile devices, used a higher performance processor, and was more power efficient in the CPU by a good margin. AMD competed more for desktop market share, where power limits were less of a concern, and gave similar or better peak graphics performance at a much lower cost. For the low-end graphics market, this suited them fine, although AMD were still behind on general CPU performance which did put certain segments of users off.
What AMD did notice is that one of the limits for these integrated designs was memory bandwidth. For several years, they continually released products that had a higher base memory support over Intel: when Intel still had DDR3-1600 listed as the supported frequency, AMD was moving up to DDR3-2133, which boosted that graphics performance by a fair margin. You can see in our memory scaling article with Intel's Haswell products that DDR3-1600 was effectively a black-hole at unlocking integrated graphics performance, especially when it came to minimum frame rates.
At this stage in history, memory bandwidths to the CPU were around 20 GB/s, compared to discrete graphics that were pushing 250GB/s. The memory bandwidth issue was not unnoticed by Intel, and so with Broadwell they introduced the 'Crystalwell' line of Broadwell processors: these featured the largest implementation of Intel's latest graphics design, paired with embedded DRAM silicon in the package. This 'eDRAM', up to 128MB of it, was a victim cache, allowing the processor to re-use data (like textures) that had been fetched from memory and already used at a rate of 50 GB/s (bidirectional). The ability to hold data relevant to graphics rendering closer to the processor, at a faster bandwidth than main memory, paired with Intel's best integrated graphics design, heralded a new halo product in the category. This eDRAM processor line also gave speed ups for other memory bandwidth limited tasks that reused data, as stated when we reviewed it. The big downside to this was price: adding a new bit of silicon to the package, by some accounts, was fairly cheap: but Intel sold them at a high premium, aimed at one specific customer with a fruit logo. Some parts were also made available to end-users, very briefly before being removed from sale, and it was quoted in other press that OEMs did not like the price.
AMD's response, due to how their R&D budgets and manufacturing agreements were in place, was not to specifically compete with a similar technology. The solution with the resources at hand was to dedicate more silicon space to graphics. This meant the final APUs on the FM2+ platform, using Bulldozer-family CPU cores, offered 10 compute units (512SPs) at a high frequency, with DDR3-2133 support, for under half the price. For peak performance, AMD was going toe-to-toe, but winning on price and availability.
Fast forward almost two years, to the start of 2018. Intel did have a second generation eDRAM product, where that 128 MB of extra memory acted like a true level 4 cache, allowing it to be used a lot more, however the release was muted and very limited: for embedded systems only, and again, focused onr one customer. The integrated graphics in other Intel solutions has focused more on video encode and decode support, rather than peak graphics performance. AMD had also released a platform only to OEMs, called Bristol Ridge. This used the latest Excavator-based Bulldozer-family cores, paired with 10 compute units (512 SPs) of GCN, but with DDR4-2133. The new design pushed integrated performance again, but AMD were not overly keen on promoting the line: it only had an official consumer launch significantly later, and no emphasis was placed in the media on its use. AMD has been waiting for the next generation product to make another leap in integrated graphics performance.
During 2017, AMD launched its Ryzen desktop processors, using the new Zen x86 microarchitecture. This was a return to high performance, with AMD quoting a 52% gain over its previous generation at the same frequency, by fundamentally redesigning how a core should be made. We reviewed the Ryzen 7 processor line, as well as Ryzen 5, Ryzen 3, Ryzen Threadripper, and the enterprise EPYC processors, all built with the same core layout, concluding that AMD now had a high performance design within a shout of competing in a market that values single-threaded performance. AMD also heavily competed on performance per dollar, undercutting the competition and making the Ryzen family headline a number of popular Buyer's Guides, including our own. AMD also launched a new graphics design, called Vega. AMD positioned the Vega products to be competitive against NVIDIA dollar for dollar, and although the power consumption for the high-end models (up to 64 compute units) was questionable, AMD currently cannot make enough Vega chips to fulfil demand, as certain workloads perform best on Vega. In a recent financial call, CEO Dr. Lisa Su stated that they are continually ramping (increasing) the production of Vega discrete graphics cards because of that demand. Despite the power consumption for graphics workloads on the high-end discrete graphics, it has always been accepted that the peak efficiency point for the Vega design is something smaller and lower frequency. It would appear that Intel in part agrees with this statement, as it has recently introduced the Intel Core with Radeon RX Vega graphics processor, combining its own high-performance cores with mid-sized Vega chip, powered by high-bandwidth memory. The reason for choosing an AMD graphics chip rather than rolling its own, according to Intel, is that it is the right part for that product segment.
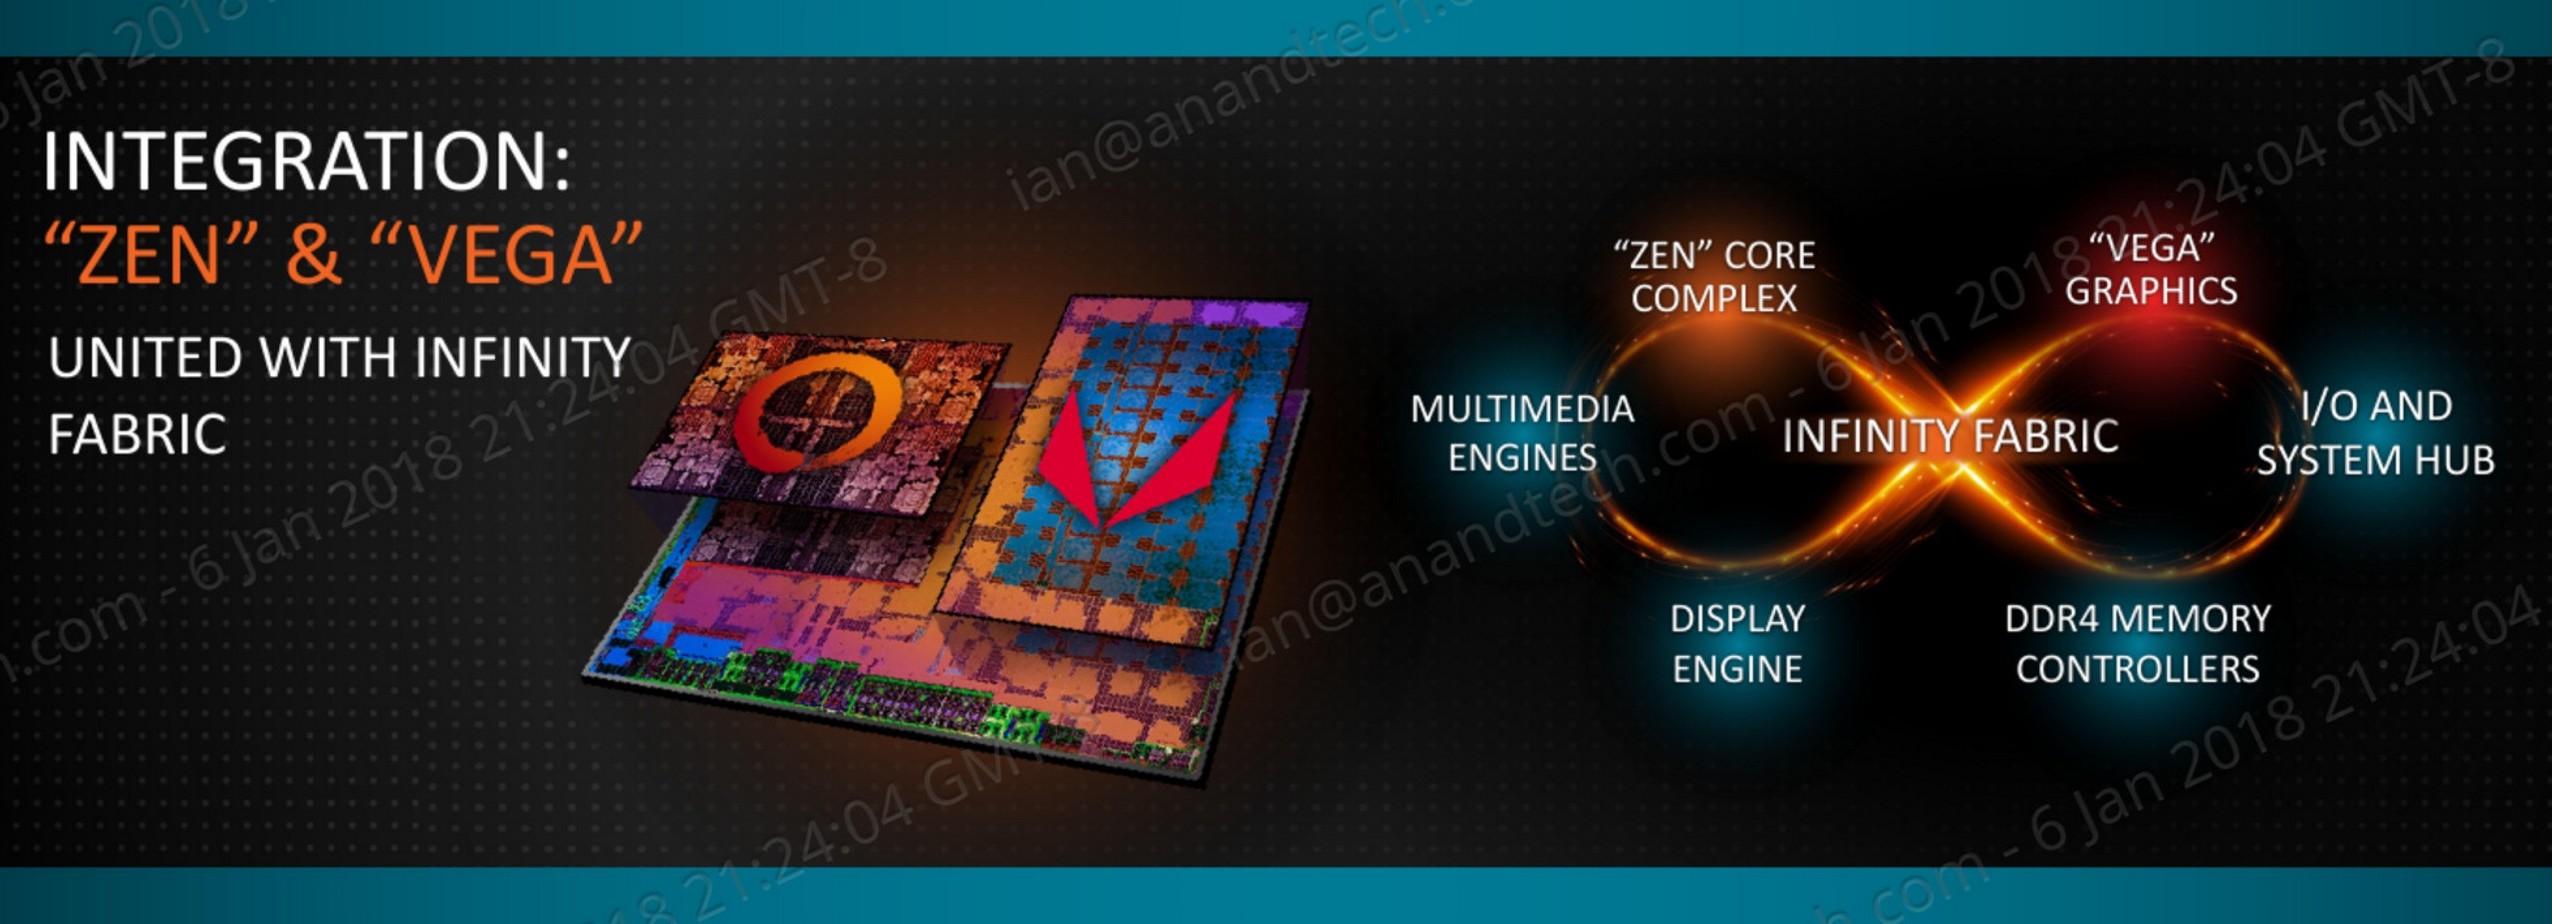
So a similar reasoning for today’s launch: combine a high-performance core with a high-performance graphics core. For the new Ryzen Desktop APUs being launched today, AMD has combined four of its high performance x86 Zen cores and a smaller version of Vega graphics into the same piece of silicon. As with all silicon manufacturing, the APU design has to hit the right point on performance, power, die area, and cost, and with these products AMD is focusing squarely on the entry-level gaming performance metric, for users that are spending $400-$600 on the entire PC, including motherboard, memory, case, storage, power supply and operating system. The idea is that high-performance processor cores, combined with high-performance graphics, can create a product that has no equal for the market.
Analysis taken from our AMD Tech Day 2018 article.
AMD’s main target with these new processors is to offer something Intel cannot: a combined processor and graphics package. Much like a number of AMD’s previous generation of products, the focus is two-fold: offering more performance at the same price, or being cheaper at equal performance.
For the first part of that argument, about having more performance at the same price, AMD suggests the following competition for the Ryzen 5 2400G:
- $169 Ryzen 5 2400G (4C/8T, 3.6 GHz, 704 SPs)
- $182 Core i5-7400 (4C/4T, xxx, 24 EUs)
- $187 Core i5-8400 (6C/6T, xxx, 24 EUs)
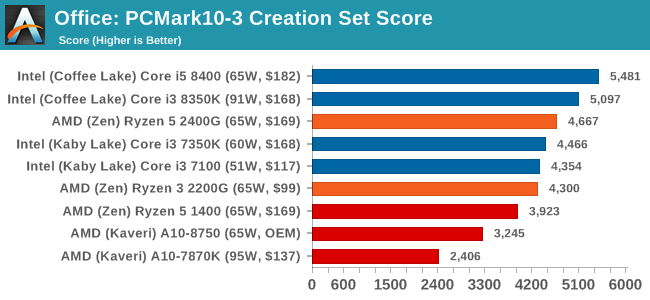
AMD cites that in its internal testing, the 2400G scores 20% higher than the i5-8400 on PCMark 10, and can post 1920x1080 gaming results above 49 FPS in titles such as Battlefield One, Overwatch, Rocket League, and Skyrim, having 2x to 3x higher framerates than Intel’s integrated graphics. This is a claim we can confirm in this review.
For the Ryzen 3 2200G, the competing products are less well defined:
- $99 Ryzen 3 2200G (4C/4T, 3.5 GHz, 512 SPs)
- $117 Core i3-8100 (4C/4T, xxx, 23 EUs)
- $84 Pentium G4620 (2C/4T, xxx, 12 EUs)
Again, through its internal testing, AMD is stating that the 2200G scores 13% higher than the Core i3-8100 in PCMark 10, as well as being within a few frames of the Ryzen 3 2400G in titles such as Rocket League, Skyrim, and Battlefield One. We have a similar scenario tested in this review.
The other side of the argument is price for the same performance. For this comparison, AMD suggests to test the new APUs against Intel processors paired with NVIDIA graphics, specifically the GT 1030. AMD’s data suggests that a Core i5-8400 with a GT1030 scores the same as a Ryzen 5 2400G in the 3DMark TimeSpy benchmark, although costing $290 (vs $169 for the APU) and drawing 30W more power. This is a scenario we also test in this review.
These two new APUs have the internal codename of ‘Raven Ridge’ to signify the family of products. AMD also has ‘Bristol Ridge’ already in the market, using the previous generation of CPU cores and previous generation of integrated graphics. AMD has not actively promoted Bristol Ridge to the public in any serious way, with these parts being hold-overs from the previous platform and designed to be a quick fill within AMD’s product line. To that effect, Bristol Ridge processors were only available for OEMs at the beginning for pre-built systems, and AMD only made them available to the public within the last few months. To our knowledge, AMD did not initiate a review sampling program to the press of these processors either.
With the launch of the two new Zen-plus-Vega Raven Ridge APUs, the Bristol Ridge processors will still continue to be sold. AMD’s reasoning revolves around offering choice in the market, particularly to its OEM customers, and has stated that the two products offer different features and is thus not competing on price. It is clear to say that for anyone buying a new system, the newest products offer the better value: a much higher per-core performance, improved thermal budgeting, newer integrated graphics, and ultimately the core design is the future of AMD. The only items that Bristol Ridge brings to the table now are the legacy aspect, to replace like-for-like, and the offer of a number of 35W-rated products. Bristol Ridge PRO processors are also on the market, offered alongside the new Ryzen PRO with Vega.
Squaring up the competing parts shows that:
| Raven Ridge vs. Bristol Ridge | |||||
| Ryzen 5 2400G | A12-9800 | Ryzen 3 2200G | A10-9700 | ||
| Core uArch | Zen | Excavator | Zen | Excavator | |
| Cores/Threads | 4 / 8 | 2 / 4 | 4 / 4 | 2 / 4 | |
| Base CPU Frequency | 3.6 GHz | 3.8 GHz | 3.5 GHz | 3.5 GHz | |
| Turbo CPU Frequency | 3.9 GHz | 4.2 GHz | 3.7 GHz | 3.8 GHz | |
| TDP | 65 W | 65 W | 65 W | 65 W | |
| cTDP | 46-65 W | 45-65W | 46-65 W | 45-65W | |
| L2 Cache | 512 KB/core | 1 MB/core | 512 KB/core | 1 MB/core | |
| L3 Cache | 4 MB | - | 4 MB | - | |
| Graphics | Vega 11 | GCN 3 Gen | Vega 8 | GCN 3 Gen | |
| Compute Units | 11 CUs | 8 CUs | 8 CUs | 6 CUs | |
| Streaming Processors | 704 SPs | 512 SPs | 512 SPs | 384 SPs | |
| Base GPU Frequency | 1250 MHz | 1108 MHz | 1100 MHz | 1029 MHz | |
| DRAM Support | DDR4-2933 | DDR4-2400 | DDR4-2933 | DDR4-2400 | |
| Price | $169 | $99 | $99 | $79 | |
Given the performance uplift we have seen from previous generation A-series processors to the Ryzen desktop parts already, the new APUs should put the nail in the coffin for older AMD parts.
As per our processor testing policy, we take a premium category motherboard suitable for the socket, and equip the system with a suitable amount of memory running at the manufacturer's maximum supported frequency. This is also typically run at JEDEC subtimings where possible. It is noted that some users are not keen on this policy, stating that sometimes the maximum supported frequency is quite low, or faster memory is available at a similar price, or that the JEDEC speeds can be prohibitive for performance. While these comments make sense, ultimately very few users apply memory profiles (either XMP or other) as they require interaction with the BIOS, and most users will fall back on JEDEC supported speeds - this includes home users as well as industry who might want to shave off a cent or two from the cost or stay within the margins set by the manufacturer. Where possible, we will extend out testing to include faster memory modules either at the same time as the review or a later date.
| Test Setup | ||||
| AMD | Intel Core | |||
| Processor | Ryzen 5 2400G Ryzen 3 2200G | A10-8750 A8-7870K | i7-8700 i3-8350K | i5-7400 i3-7350K i3-7100 |
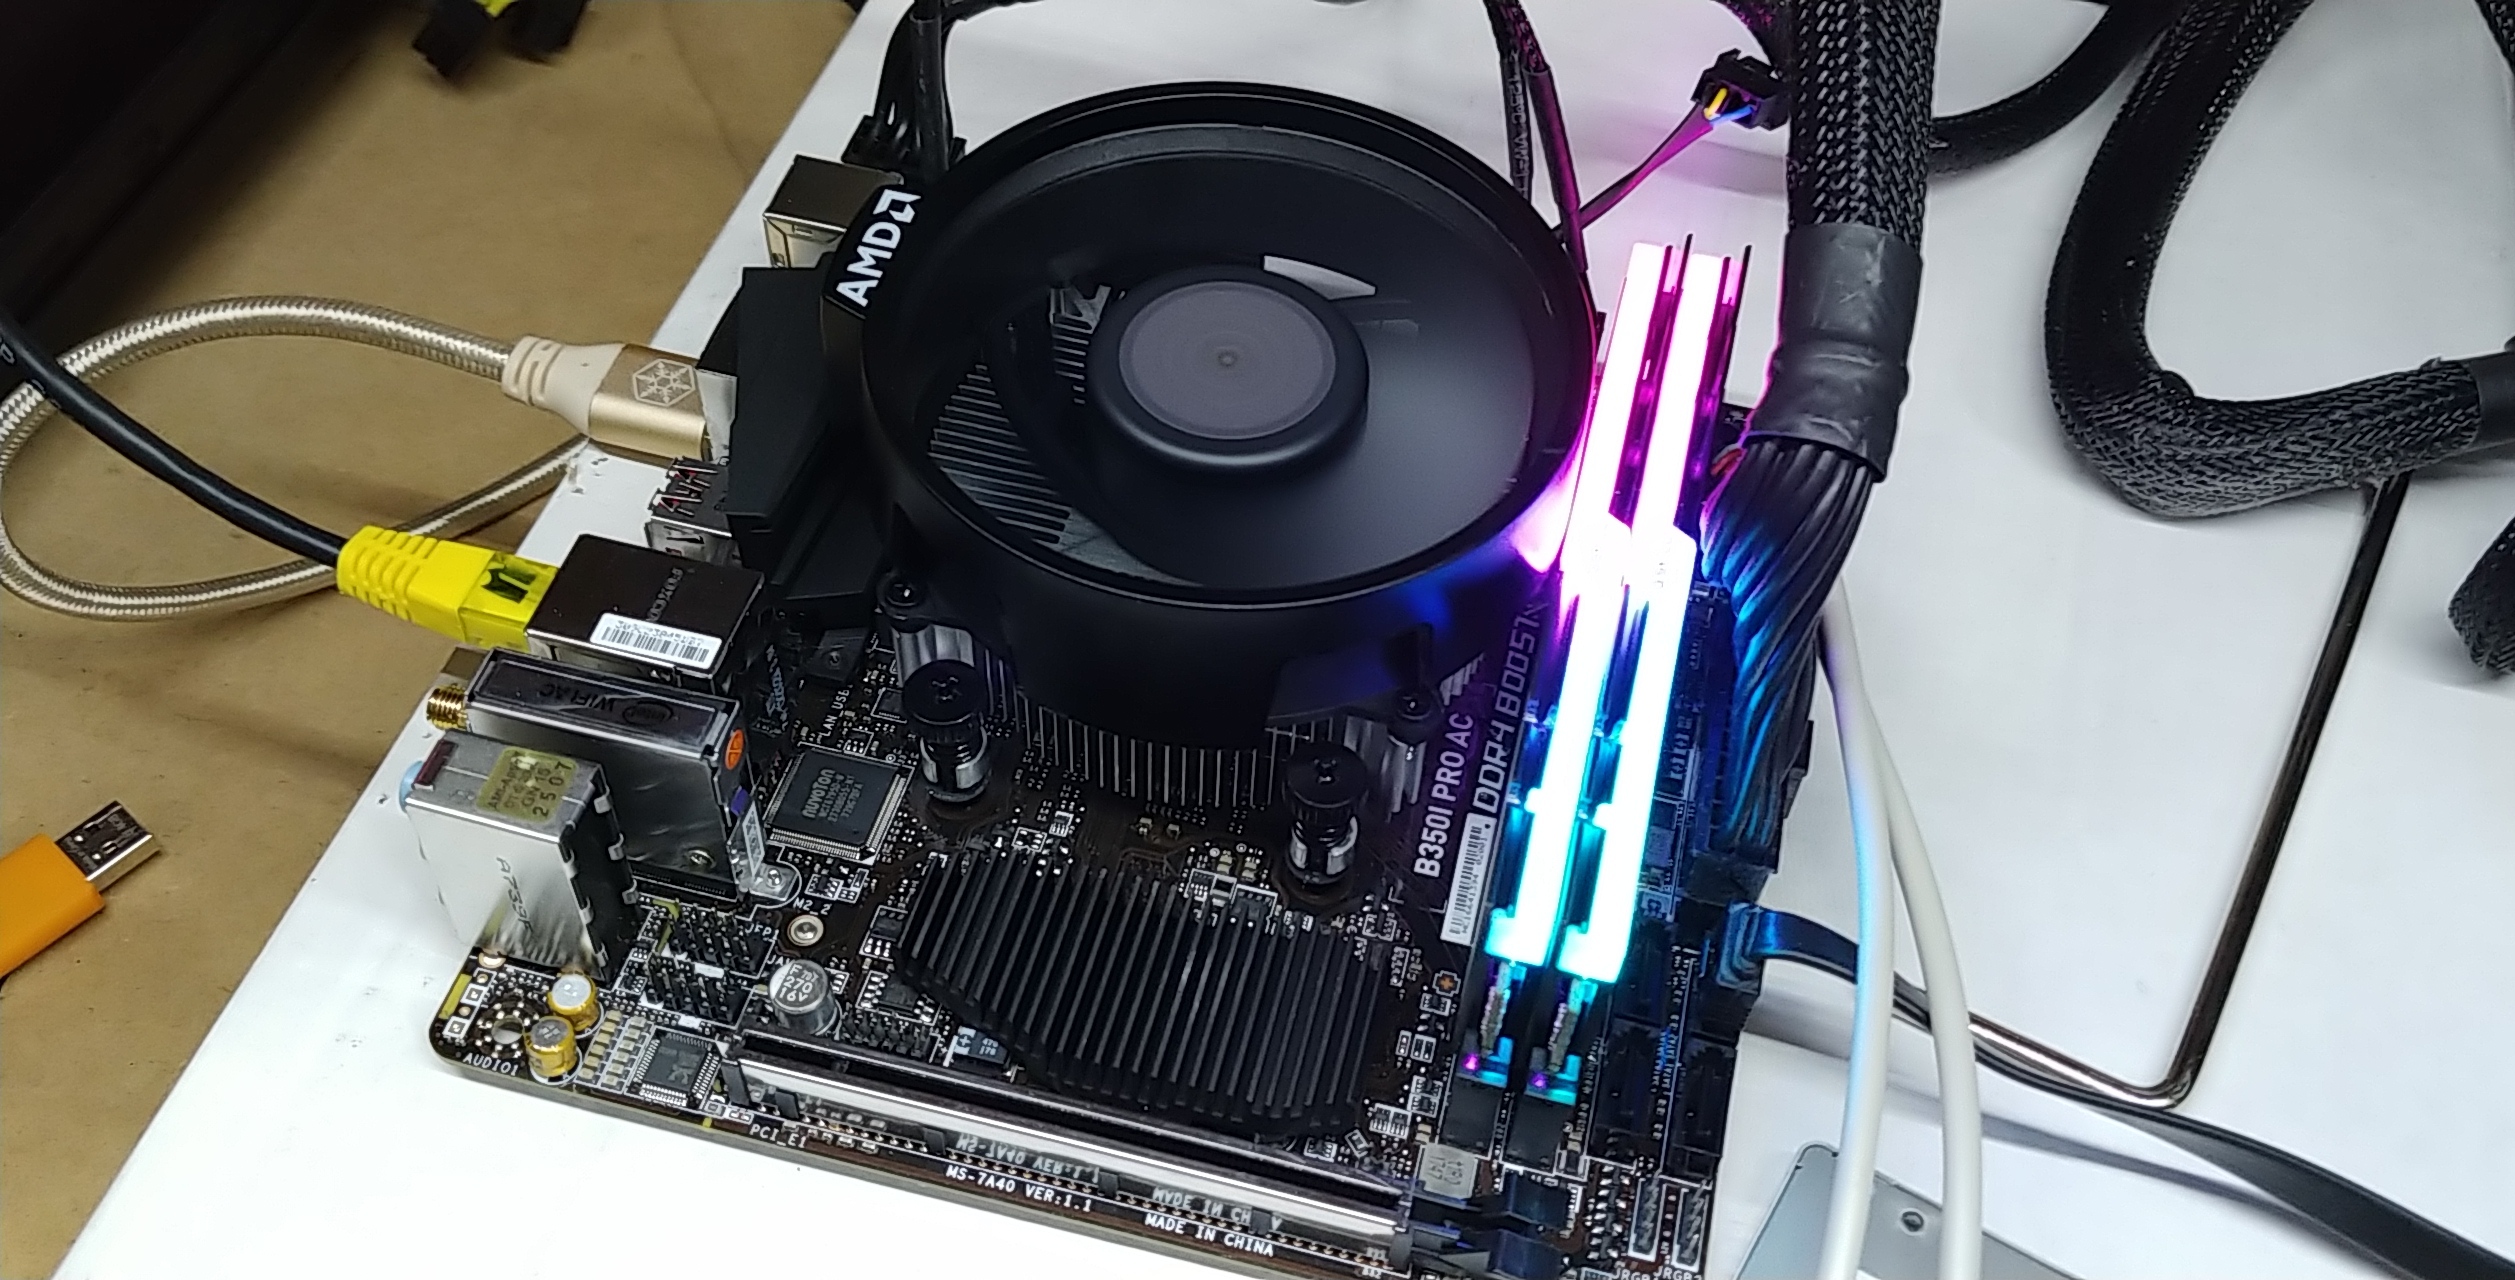
| Motherboards | MSI B350I Pro AC | ASUS A88X-Pro | ASRock Z370 Gaming i7 | GIGABYTE X170 Gaming ECC |
| Cooling | AMD Wraith Stealth | Arctic Freezer 13 ICO | Silverstone AR10-115XS | |
| Power Supply | Corsair AX760i PSU | |||
| Memory | G.Skill TridentZ 2x8GB DDR4-3200 @ 2933 | G.Skill RipjawsX 2x8GB DDR3-2133 | Crucial Ballistix 4x8GB DR4-2666 | G.Skill RipjawsV 2x16GB DDR4-2400 |
| Video Drivers | Ryzen APU: 17.7 beta NVIDIA GT 1030: 388.52 Intel IGP: 15.60.2.4901 | |||
| Hard Drive | Crucial MX200 1TB | |||
| Optical Drive | LG GH22NS50 | |||
| Case | Open Test Bed | |||
| Operating System | Windows 10 Pro 64-bit | |||
Many thanks to...
We must thank the following companies for kindly providing hardware for our multiple test beds. Some of this hardware is not in this test bed specifically, but is used in other testing.
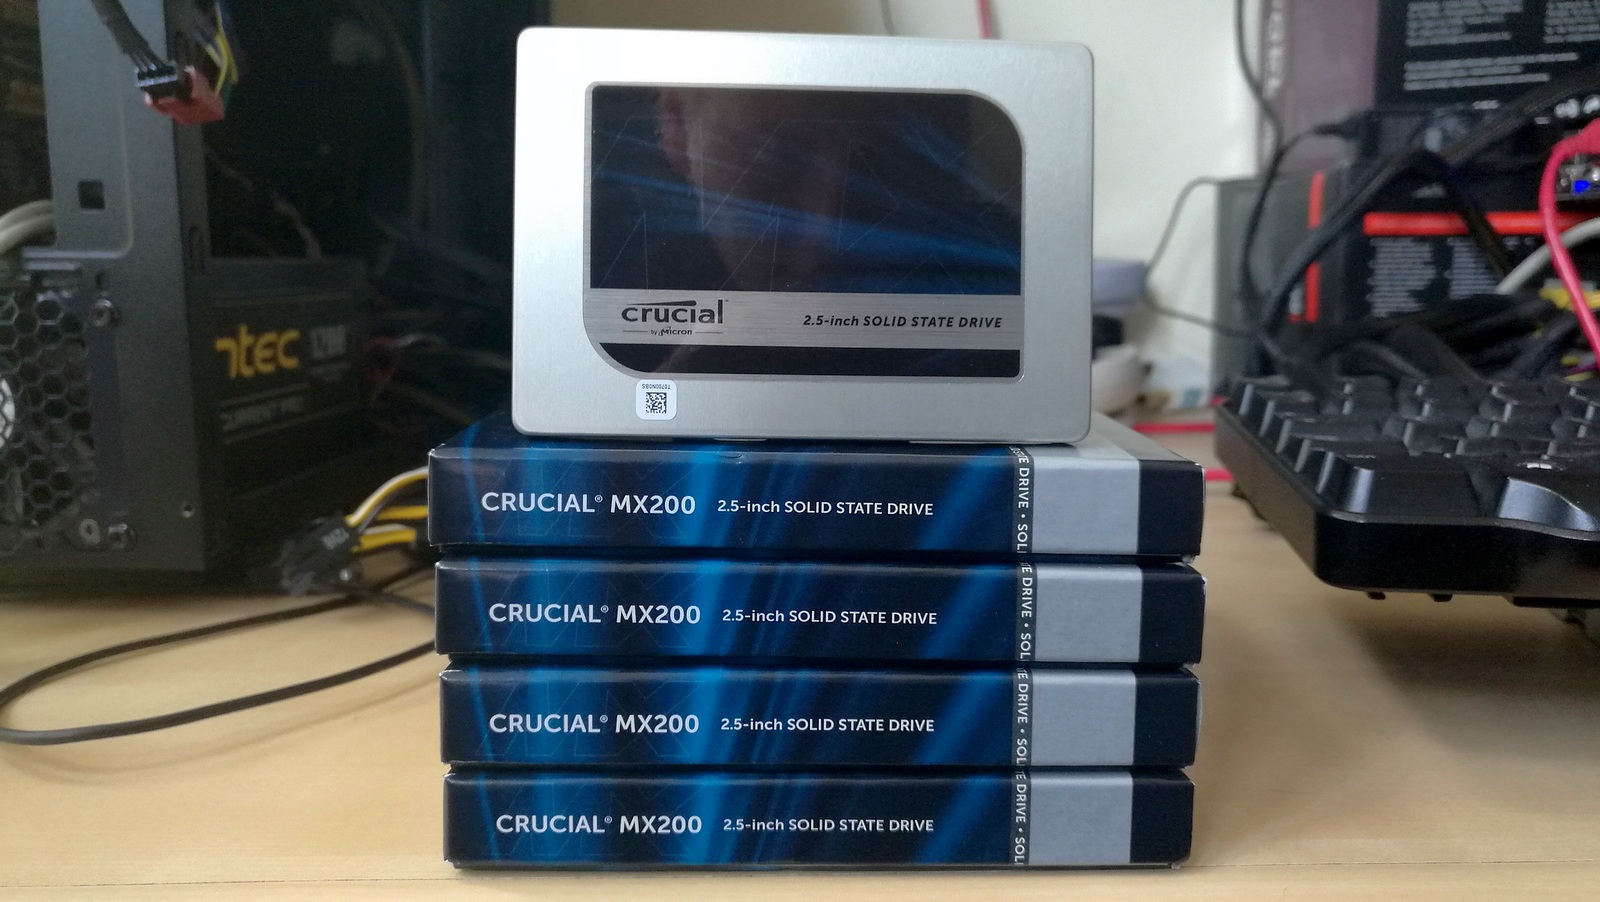
Thank you to Crucial for providing us with MX200 SSDs. Crucial stepped up to the plate as our benchmark list grows larger with newer benchmarks and titles, and the 1TB MX200 units are strong performers. Based on Marvell's 88SS9189 controller and using Micron's 16nm 128Gbit MLC flash, these are 7mm high, 2.5-inch drives rated for 100K random read IOPs and 555/500 MB/s sequential read and write speeds. The 1TB models we are using here support TCG Opal 2.0 and IEEE-1667 (eDrive) encryption and have a 320TB rated endurance with a three-year warranty.
Further Reading: AnandTech's Crucial MX200 (250 GB, 500 GB & 1TB) Review
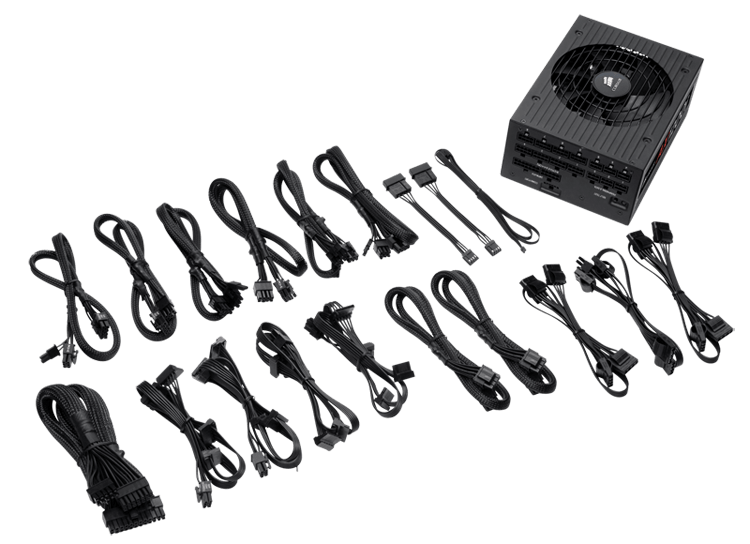
Thank you to Corsair for providing us with an AX1200i PSU. The AX1200i was the first power supply to offer digital control and management via Corsair's Link system, but under the hood it commands a 1200W rating at 50C with 80 PLUS Platinum certification. This allows for a minimum 89-92% efficiency at 115V and 90-94% at 230V. The AX1200i is completely modular, running the larger 200mm design, with a dual ball bearing 140mm fan to assist high-performance use. The AX1200i is designed to be a workhorse, with up to 8 PCIe connectors for suitable four-way GPU setups. The AX1200i also comes with a Zero RPM mode for the fan, which due to the design allows the fan to be switched off when the power supply is under 30% load.
Further Reading: AnandTech's Corsair AX1500i Power Supply Review
Thank you to G.Skill for providing us with memory. G.Skill has been a long-time supporter of AnandTech over the years, for testing beyond our CPU and motherboard memory reviews. We've reported on their high capacity and high-frequency kits, and every year at Computex G.Skill holds a world overclocking tournament with liquid nitrogen right on the show floor.
Further Reading: AnandTech's Memory Scaling on Haswell Review, with G.Skill DDR3-3000
For our review, we are implementing our latest CPU testing benchmark suite, using automated scripts developed specifically for our CPU reviews. This means that with a fresh OS install, we can configure the OS to be more consistent, install the new benchmarks, maintain version consistency without random updates and start running the tests in under 5 minutes. After that it's a one button press to start an 8-10hr test (with a high-performance core) with nearly 100 relevant data points in the benchmarks given below. The tests cover a wide range of segments, some of which will be familiar but some of the tests are new to benchmarking in general, but still highly relevant for the markets they come from.
Our new CPU tests go through six main areas. We cover the Web (we've got an un-updateable version of Chrome 56), general system tests (opening tricky PDFs, emulation, brain simulation, AI, 2D image to 3D model conversion), rendering (ray tracing, modeling), encoding (compression, AES, h264 and HEVC), office based tests (PCMark and others), and our legacy tests, throwbacks from another generation of bad code but interesting to compare.
All of our benchmark results can also be found in our benchmark engine, Bench.
A side note on OS preparation. As we're using Windows 10, there's a large opportunity for something to come in and disrupt our testing. So our default strategy is multiple: disable the ability to update as much as possible, disable Windows Defender, uninstall OneDrive, disable Cortana as much as possible, implement the high performance mode in the power options, and disable the internal platform clock which can drift away from being accurate if the base frequency drifts (and thus the timing ends up inaccurate).
*Please note that due to time constraints, the data in this review does not take into account any effect from the Meltdown and Spectre patches.
Web Tests on Chrome 56
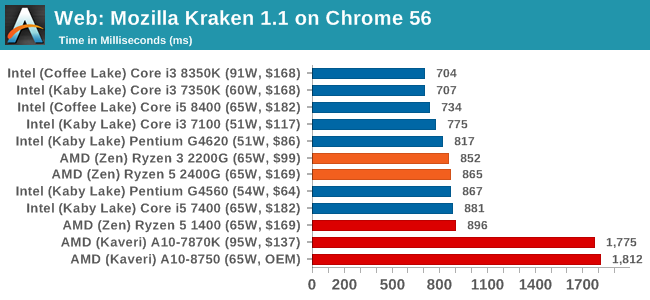
Mozilla Kraken 1.1
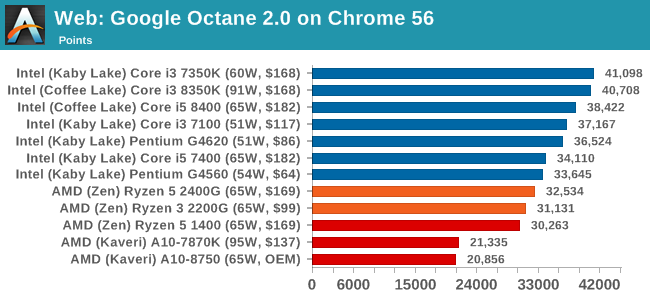
Google Octane 2.0
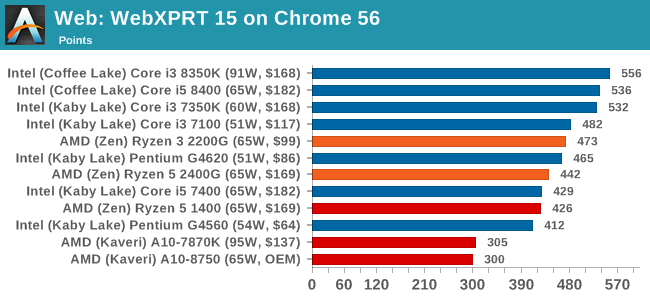
WebXPRT15
System Tests
PDF Opening
FCAT
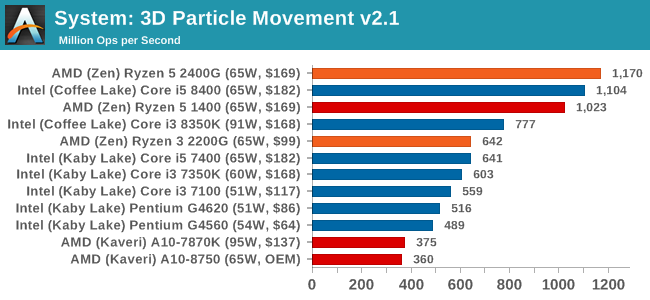
3DPM v2.1
Dolphin v5.0
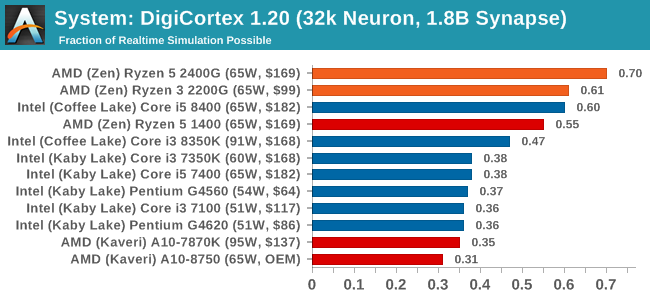
DigiCortex v1.20
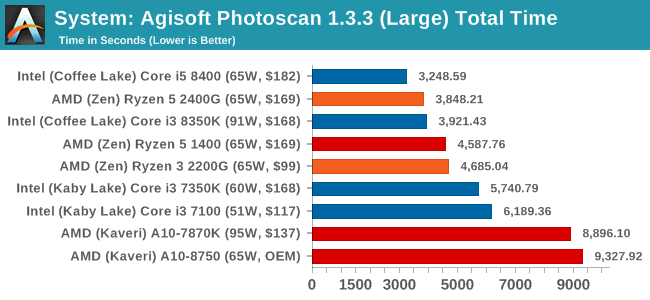
Agisoft PhotoScan v1.0
Rendering Tests
Corona 1.3
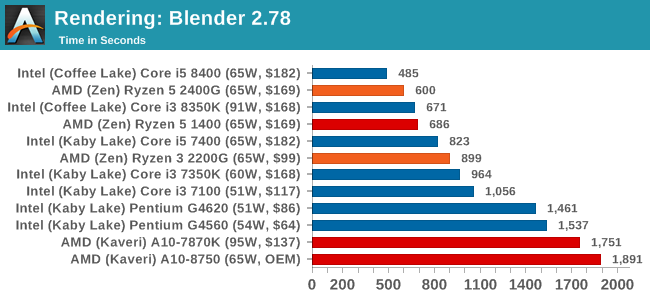
Blender 2.78
LuxMark v3.1 CPU C++
LuxMark v3.1 CPU OpenCL
POV-Ray 3.7.1b4
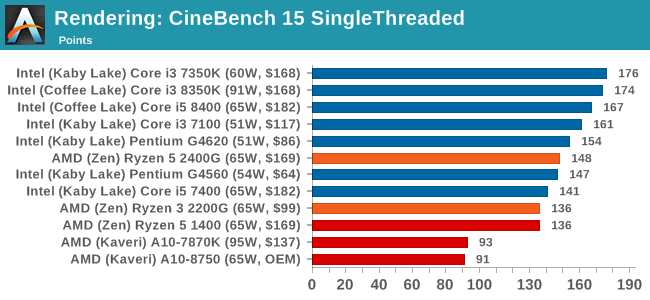
Cinebench R15 ST
Cinebench R15 MT
Encoding Tests
7-Zip 9.2
WinRAR 5.40
AES Encoding (TrueCrypt 7.2)
HandBrake v1.0.2 x264 LQ
HandBrake v1.0.2 x264-HQ
HandBrake v1.0.2 HEVC-4K
Office / Professional
PCMark8
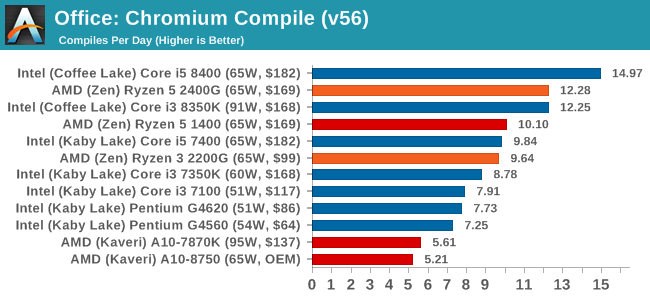
Chromium Compile (v56)
Legacy Tests
3DPM v1 ST / MT
x264 HD 3 Pass 1, Pass 2
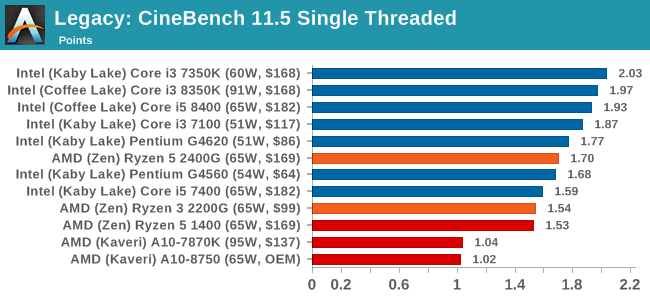
Cinebench R11.5 ST / MT
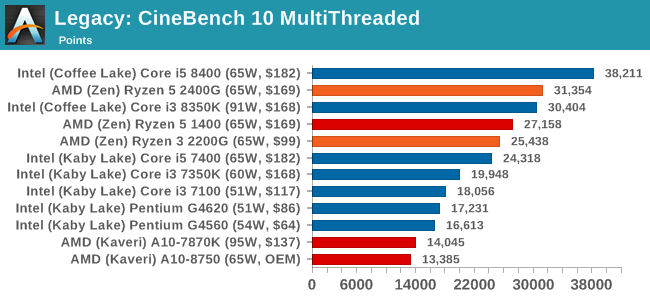
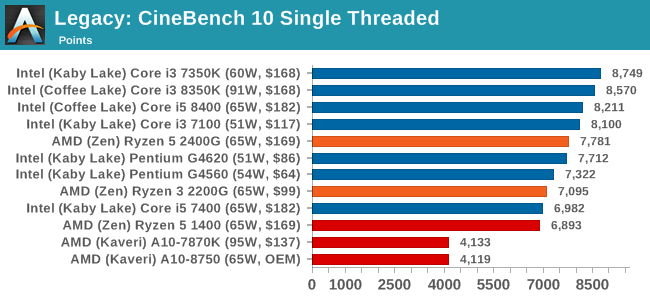
Cinebench R10 ST / MT
For this review, we have taken two angles with our testing: integrated vs integrated, and integrated vs low-end discrete. To this end, we purchased an MSI GT 1030 4GB graphics card to compare against the integrated offerings, as well as testing AMD and Intel's integrated options. For our gaming tests, we ran the 1080p version of all of our benchmarks:
- Civilization 6 (1080p Ultra)
- Ashes of the Singularity: Escalation*
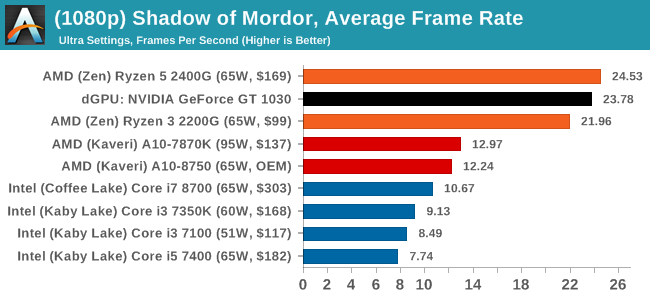
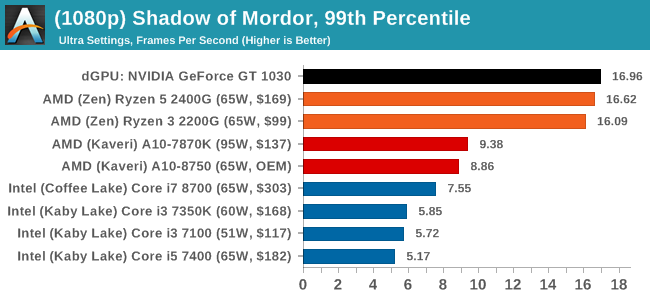
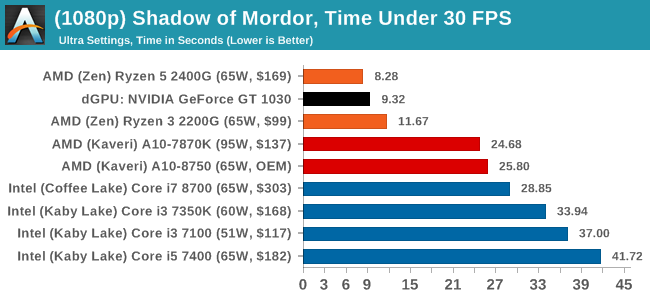
- Shadow of Mordor (1080p Ultra)
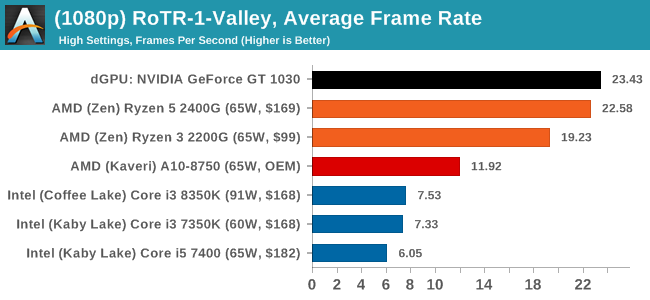
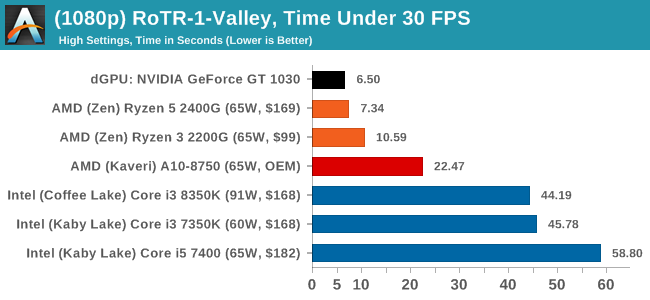
- Rise of the Tomb Raider #1 - GeoValley (1080p High)
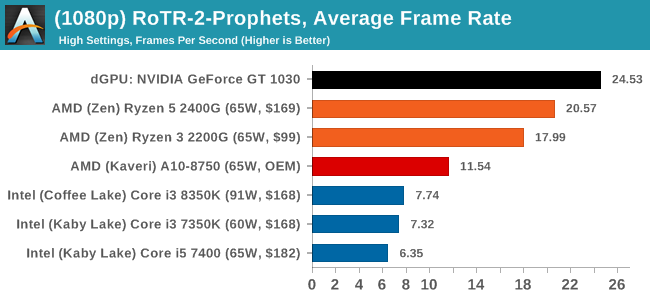
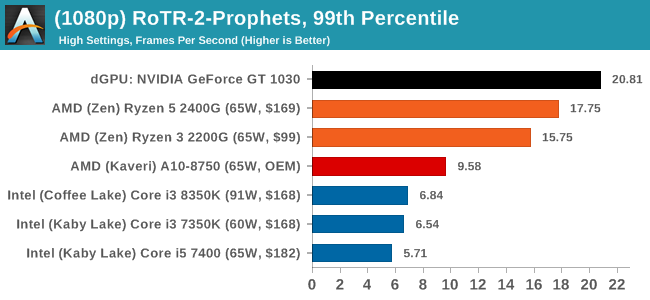
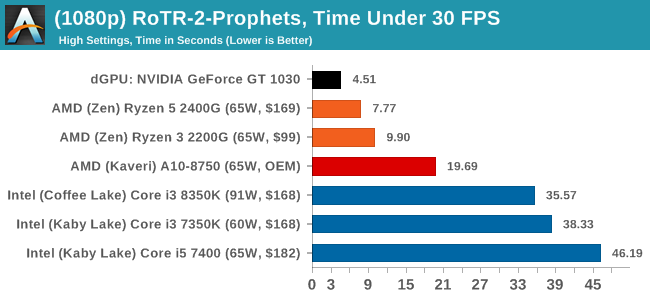
- Rise of the Tomb Raider #2 - Prophets (1080p High)
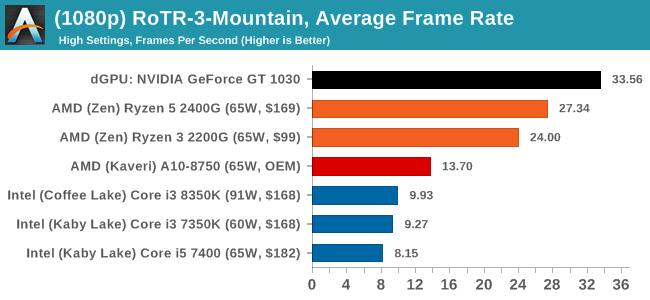
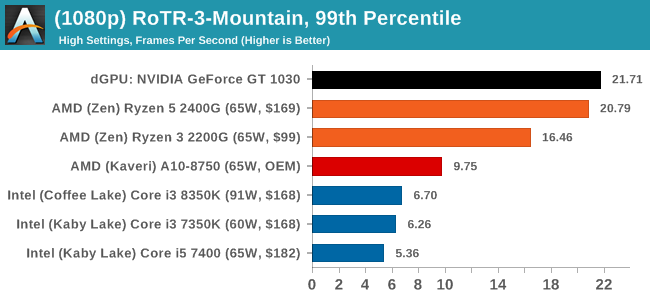
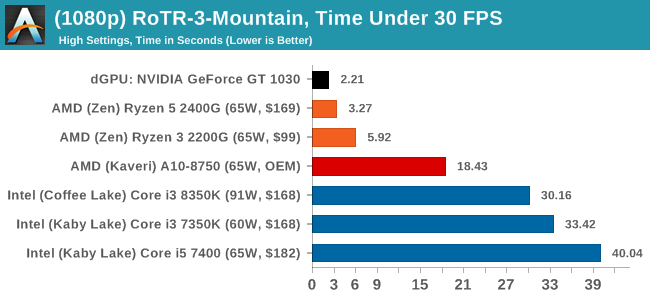
- Rise of the Tomb Raider #3 - Mountain (1080p High)
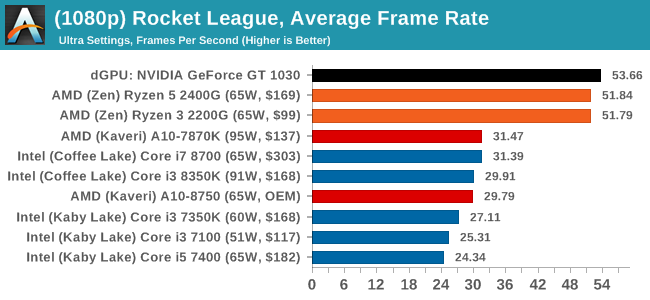
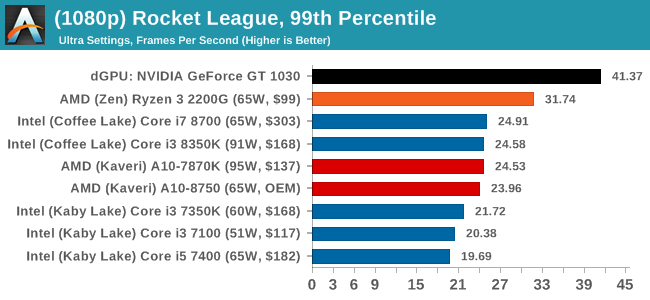
- Rocket League (1080p Ultra)
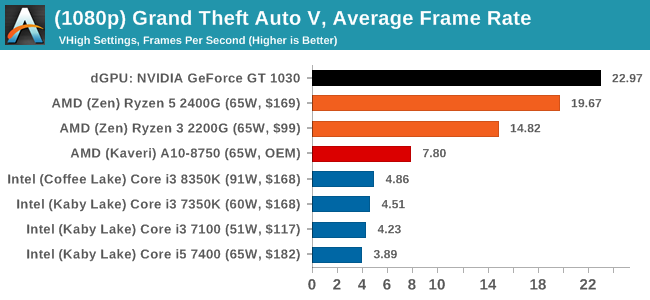
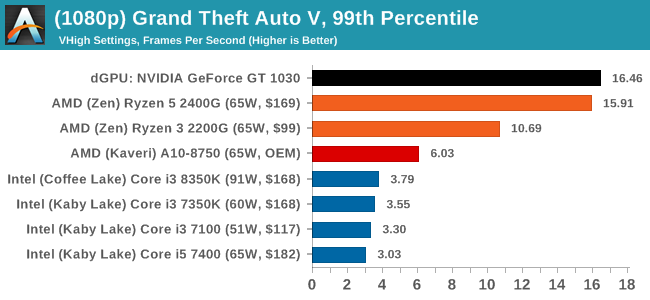
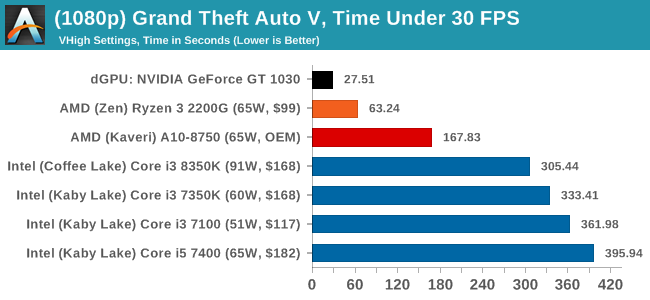
- Grand Theft Auto V (1080p Very High)
*Ashes recently had an update which broke our script, and it is not an easy fix, so we have removed this game from our testing
These games are a cross of mix of eSports and high-end titles, and to be honest, we have pushed the quality settings up higher than most people would expect for this level of integrated graphics: most benchmarks hit around 25-30 FPS average with the best IGP solutions, down to 1/3 this with the worst solutions. The best results show that integrated graphics are certainly capable with the right settings, but also shows that there is a long way between integrated graphics and a mid-range discrete graphics option.
Throughout their history of having fully integrated GPUs, AMD has always favored going for powerful configurations that approach the lower-end of discrete GPU performance. With comparable discrete cards going for $80 or more, a powerful iGPU is a significant value proposition for AMD’s APUs. Furthermore as Intel has continued to stick with relatively lightweight iGPUs for most mainstream SKUs – a trend even the newly released “Coffee Lake” 8th Gen Core family continues – AMD has easily trounced Intel’s iGPU performance.
In fact the most recent 8th Gen Core CPUs generally fail to catch up to AMD’s last-generation 7000/8000 series “Kaveri” APUs, which means that for the launch of AMD’s new Ryzen APUs, the manufacturer is just going to be running up the lead even more. The real question we’ll be looking at on the iGPU side isn’t what’s faster – that’s obvious – but just how many times faster the 2400G & 2200G APUs are over their Intel equivalents, and how they stack up against an entry level discrete video card, the GeForce GT 1030. With upwards of 11 CUs in an APU, on paper the Ryzen APUs should be able to offer 1080p@30fps gaming at maximum (or near-maximum) image quality.
During our pre-briefing, several sets of benchmarks and configurations were 'suggested', focusing on eSports and a mid-range quality setting, to show what the platform can do. For our testing, we used our CPU Gaming 1080p gaming suite. This suite was developed with mid-range and high-end graphics cards in mind, with mostly high or ultra quality settings, pushing beyond what was suggested. The reason we did this was two fold:
- In our data, it shows a sizeable difference between integrated graphics solutions that can offer potential, compared to those that fall at the first hurdle.
- Second, it offers a stark reminder that while for the most part websites and enthusiasts like as way lyrical about high-end performance, the data shows both how far integrated graphics has come, and how far it still has to go to qualify for those 'immerse experiences' that Intel, AMD, and NVIDIA all claim are worth reaching for, with higher resolutions and higher fidelity.
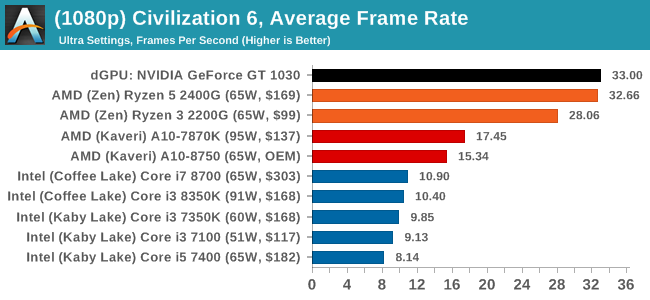
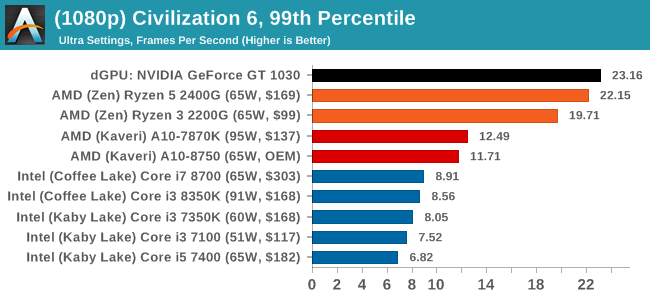
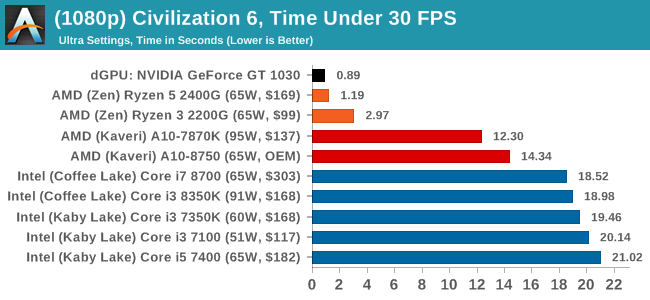
Civilization 6
First up in our CPU gaming tests is Civilization 6. Originally penned by Sid Meier and his team, the Civ series of turn-based strategy games are a cult classic, and many an excuse for an all-nighter trying to get Gandhi to declare war on you due to an integer overflow. Truth be told I never actually played the first version, but every edition from the second to the sixth, including the fourth as voiced by the late Leonard Nimoy, it a game that is easy to pick up, but hard to master.
Shadow of Mordor
The next title in our testing is a battle of system performance with the open world action-adventure title, Middle Earth: Shadow of Mordor (SoM for short). Produced by Monolith and using the LithTech Jupiter EX engine and numerous detail add-ons, SoM goes for detail and complexity. The main story itself was written by the same writer as Red Dead Redemption, and it received Zero Punctuation’s Game of The Year in 2014.
Grand Theft Auto V
The highly anticipated iteration of the Grand Theft Auto franchise hit the shelves on April 14th 2015, with both AMD and NVIDIA in tow to help optimize the title. GTA doesn’t provide graphical presets, but opens up the options to users and extends the boundaries by pushing even the hardest systems to the limit using Rockstar’s Advanced Game Engine under DirectX 11. Whether the user is flying high in the mountains with long draw distances or dealing with assorted trash in the city, when cranked up to maximum it creates stunning visuals but hard work for both the CPU and the GPU.
Rise of the Tomb Raider
One of the most comprehensive games in the gaming benchmark suite is Rise of the Tomb Raider (RoTR), developed by Crystal Dynamics, and the sequel to the popular Tomb Raider which was loved for its automated benchmark mode. But don’t let that fool you: the benchmark mode in RoTR is very much different this time around.
Visually, the previous Tomb Raider pushed realism to the limits with features such as TressFX, and the new RoTR goes one stage further when it comes to graphics fidelity. This leads to an interesting set of requirements in hardware: some sections of the game are typically GPU limited, whereas others with a lot of long-range physics can be CPU limited, depending on how the driver can translate the DirectX 12 workload.

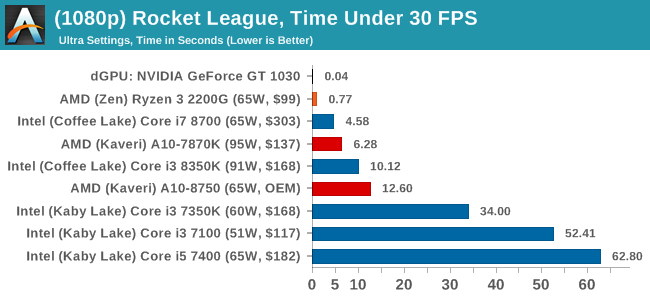
Rocket League
Hilariously simple and embodying the elements of pick-up-and-play, Rocket League allows users to jump into a game with other people (or bots) to play football with cars with zero rules. The title is built on Unreal Engine 3, which is somewhat old at this point, but it allows users to run the game on super-low-end systems while still taxing the big ones. Since the release in 2015, it has sold over 5 million copies and seems to be a fixture at LANs and game shows. Users who train get very serious, playing in teams and leagues with very few settings to configure, and everyone is on the same level. Rocket League is quickly becoming one of the favored titles for e-sports tournaments, especially when e-sports contests can be viewed directly from the game interface.
With Rocket League, there is no benchmark mode, so we have to perform a series of automated actions, similar to a racing game having a fixed number of laps. We take the following approach: Using Fraps to record the time taken to show each frame (and the overall frame rates), we use an automation tool to set up a consistent 4v4 bot match on easy, with the system applying a series of inputs throughout the run, such as switching camera angles and driving around.
Our first set of tests is our general system tests. These set of tests are meant to emulate more about what people usually do on a system, like opening large files or processing small stacks of data. This is a bit different to our office testing, which uses more industry standard benchmarks, and a few of the benchmarks here are relatively new and different.
All of our benchmark results can also be found in our benchmark engine, Bench.
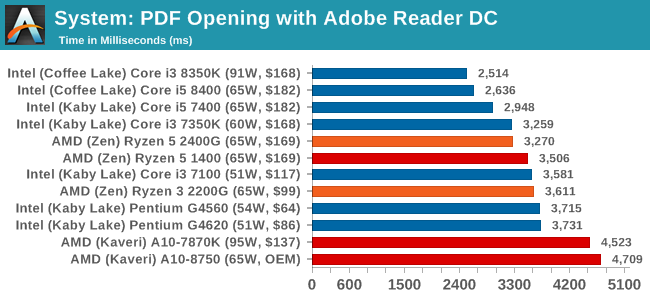
PDF Opening
First up is a self-penned test using a monstrous PDF we once received in advance of attending an event. While the PDF was only a single page, it had so many high-quality layers embedded it was taking north of 15 seconds to open and to gain control on the mid-range notebook I was using at the time. This put it as a great candidate for our 'let's open an obnoxious PDF' test. Here we use Adobe Reader DC, and disable all the update functionality within. The benchmark sets the screen to 1080p, opens the PDF to in fit-to-screen mode, and measures the time from sending the command to open the PDF until it is fully displayed and the user can take control of the software again. The test is repeated ten times, and the average time taken. Results are in milliseconds.
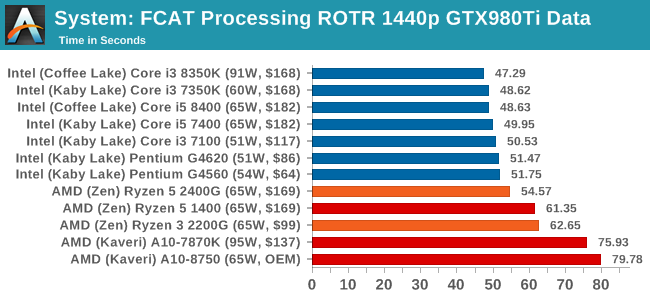
FCAT Processing: link
One of the more interesting workloads that has crossed our desks in recent quarters is FCAT - the tool we use to measure stuttering in gaming due to dropped or runt frames. The FCAT process requires enabling a color-based overlay onto a game, recording the gameplay, and then parsing the video file through the analysis software. The software is mostly single-threaded, however because the video is basically in a raw format, the file size is large and requires moving a lot of data around. For our test, we take a 90-second clip of the Rise of the Tomb Raider benchmark running on a GTX 980 Ti at 1440p, which comes in around 21 GB, and measure the time it takes to process through the visual analysis tool.
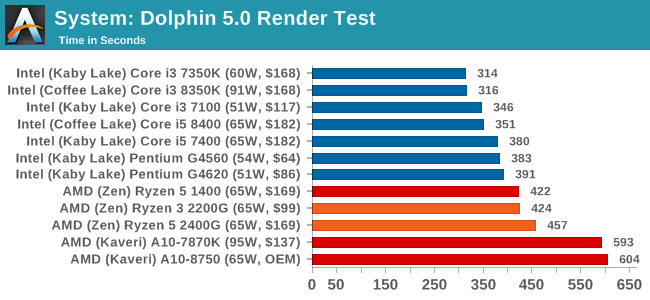
Dolphin Benchmark: link
Many emulators are often bound by single thread CPU performance, and general reports tended to suggest that Haswell provided a significant boost to emulator performance. This benchmark runs a Wii program that ray traces a complex 3D scene inside the Dolphin Wii emulator. Performance on this benchmark is a good proxy of the speed of Dolphin CPU emulation, which is an intensive single core task using most aspects of a CPU. Results are given in minutes, where the Wii itself scores 17.53 minutes.
3D Movement Algorithm Test v2.1: link
This is the latest version of the self-penned 3DPM benchmark. The goal of 3DPM is to simulate semi-optimized scientific algorithms taken directly from my doctorate thesis. Version 2.1 improves over 2.0 by passing the main particle structs by reference rather than by value, and decreasing the amount of double->float->double recasts the compiler was adding in. It affords a ~25% speed-up over v2.0, which means new data.
DigiCortex v1.20: link
Despite being a couple of years old, the DigiCortex software is a pet project for the visualization of neuron and synapse activity in the brain. The software comes with a variety of benchmark modes, and we take the small benchmark which runs a 32k neuron/1.8B synapse simulation. The results on the output are given as a fraction of whether the system can simulate in real-time, so anything above a value of one is suitable for real-time work. The benchmark offers a 'no firing synapse' mode, which in essence detects DRAM and bus speed, however we take the firing mode which adds CPU work with every firing.
Agisoft Photoscan 1.3.3: link
Photoscan stays in our benchmark suite from the previous version, however now we are running on Windows 10 so features such as Speed Shift on the latest processors come into play. The concept of Photoscan is translating many 2D images into a 3D model - so the more detailed the images, and the more you have, the better the model. The algorithm has four stages, some single threaded and some multi-threaded, along with some cache/memory dependency in there as well. For some of the more variable threaded workload, features such as Speed Shift and XFR will be able to take advantage of CPU stalls or downtime, giving sizeable speedups on newer microarchitectures.
Rendering tests are a long-time favorite of reviewers and benchmarkers, as the code used by rendering packages is usually highly optimized to squeeze every little bit of performance out. Sometimes rendering programs end up being heavily memory dependent as well - when you have that many threads flying about with a ton of data, having low latency memory can be key to everything. Here we take a few of the usual rendering packages under Windows 10, as well as a few new interesting benchmarks.
All of our benchmark results can also be found in our benchmark engine, Bench.
Corona 1.3: link
Corona is a standalone package designed to assist software like 3ds Max and Maya with photorealism via ray tracing. It's simple - shoot rays, get pixels. OK, it's more complicated than that, but the benchmark renders a fixed scene six times and offers results in terms of time and rays per second. The official benchmark tables list user submitted results in terms of time, however I feel rays per second is a better metric (in general, scores where higher is better seem to be easier to explain anyway). Corona likes to pile on the threads, so the results end up being very staggered based on thread count.

Blender 2.78: link
For a render that has been around for what seems like ages, Blender is still a highly popular tool. We managed to wrap up a standard workload into the February 5 nightly build of Blender and measure the time it takes to render the first frame of the scene. Being one of the bigger open source tools out there, it means both AMD and Intel work actively to help improve the codebase, for better or for worse on their own/each other's microarchitecture.
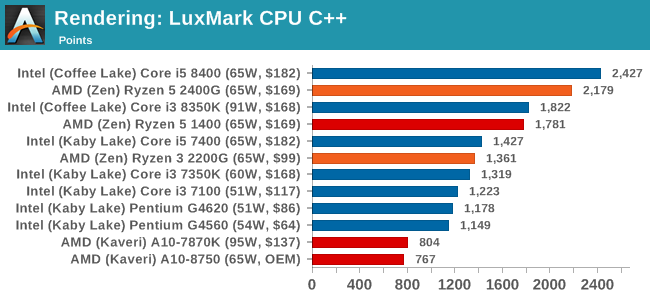
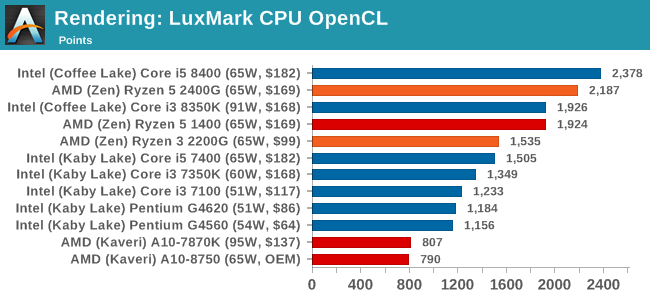
LuxMark v3.1: Link
As a synthetic, LuxMark might come across as somewhat arbitrary as a renderer, given that it's mainly used to test GPUs, but it does offer both an OpenCL and a standard C++ mode. In this instance, aside from seeing the comparison in each coding mode for cores and IPC, we also get to see the difference in performance moving from a C++ based code-stack to an OpenCL one with a CPU as the main host.
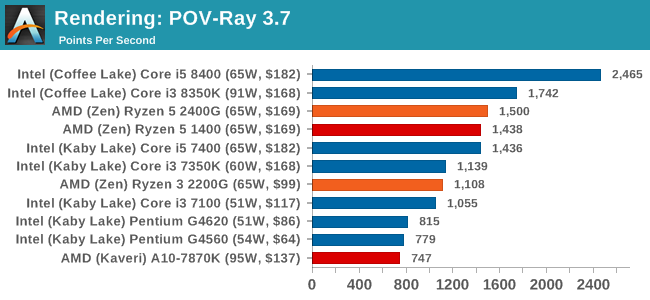
POV-Ray 3.7.1b4: link
Another regular benchmark in most suites, POV-Ray is another ray-tracer but has been around for many years. It just so happens that during the run up to AMD's Ryzen launch, the code base started to get active again with developers making changes to the code and pushing out updates. Our version and benchmarking started just before that was happening, but given time we will see where the POV-Ray code ends up and adjust in due course.
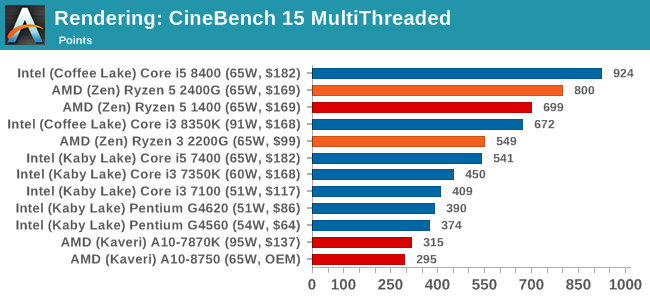
Cinebench R15: link
The latest version of CineBench has also become one of those 'used everywhere' benchmarks, particularly as an indicator of single thread performance. High IPC and high frequency gives performance in ST, whereas having good scaling and many cores is where the MT test wins out.
One of the issues when running web-based tests is the nature of modern browsers to automatically install updates. This means any sustained period of benchmarking will invariably fall foul of the 'it's updated beyond the state of comparison' rule, especially when browsers will update if you give them half a second to think about it. Despite this, we were able to find a series of commands to create an un-updatable version of Chrome 56 for our 2017 test suite. While this means we might not be on the bleeding edge of the latest browser, it makes the scores between CPUs comparable.
All of our benchmark results can also be found in our benchmark engine, Bench.
Mozilla Kraken 1.1: link
Kraken is a Javascript based benchmark, using the same test harness as SunSpider, but focusing on more stringent real-world use cases and libraries, such as audio processing and image filters. Again, the basic test is looped ten times, and we run the basic test four times.
Google Octane 2.0: link
Along with Mozilla, as Google is a major browser developer, having peak JS performance is typically a critical asset when comparing against the other OS developers. In the same way that SunSpider is a very early JS benchmark, and Kraken is a bit newer, Octane aims to be more relevant to real workloads, especially in power constrained devices such as smartphones and tablets.
WebXPRT 2015: link
While the previous three benchmarks do calculations in the background and represent a score, WebXPRT is designed to be a better interpretation of visual workloads that a professional user might have, such as browser based applications, graphing, image editing, sort/analysis, scientific analysis and financial tools.
One of the interesting elements on modern processors is encoding performance. This includes encryption/decryption, as well as video transcoding from one video format to another. In the encrypt/decrypt scenario, this remains pertinent to on-the-fly encryption of sensitive data - a process by which more modern devices are leaning to for software security. Video transcoding as a tool to adjust the quality, file size and resolution of a video file has boomed in recent years, such as providing the optimum video for devices before consumption, or for game streamers who are wanting to upload the output from their video camera in real-time. As we move into live 3D video, this task will only get more strenuous, and it turns out that the performance of certain algorithms is a function of the input/output of the content.
All of our benchmark results can also be found in our benchmark engine, Bench.
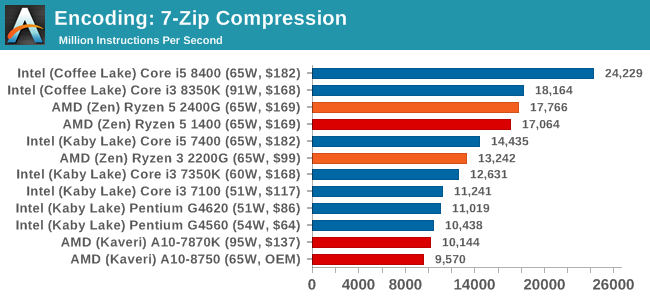
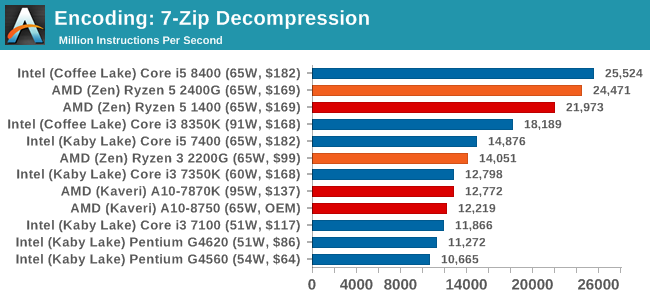
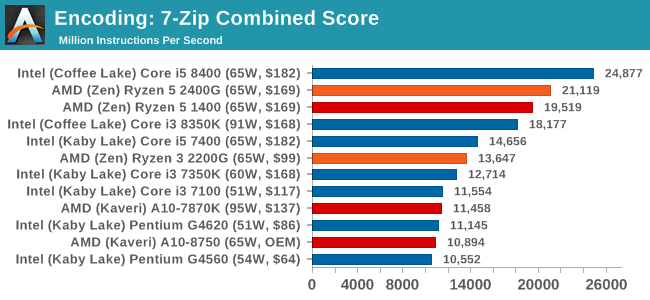
7-Zip 9.2: link
One of the freeware compression tools that offers good scaling performance between processors is 7-Zip. It runs under an open-source licence, is fast, and easy to use tool for power users. We run the benchmark mode via the command line for four loops and take the output score.
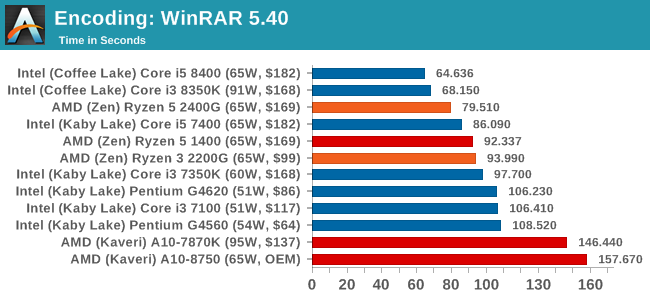
WinRAR 5.40: link
For the 2017 test suite, we move to the latest version of WinRAR in our compression test. WinRAR in some quarters is more user friendly that 7-Zip, hence its inclusion. Rather than use a benchmark mode as we did with 7-Zip, here we take a set of files representative of a generic stack (33 video files in 1.37 GB, 2834 smaller website files in 370 folders in 150 MB) of compressible and incompressible formats. The results shown are the time taken to encode the file. Due to DRAM caching, we run the test 10 times and take the average of the last five runs when the benchmark is in a steady state.
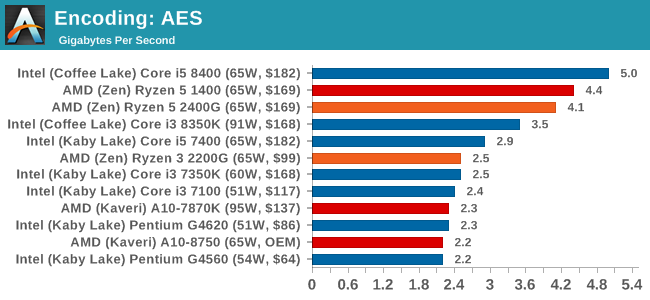
AES Encoding
Algorithms using AES coding have spread far and wide as a ubiquitous tool for encryption. Again, this is another CPU limited test, and modern CPUs have special AES pathways to accelerate their performance. We often see scaling in both frequency and cores with this benchmark. We use the latest version of TrueCrypt and run its benchmark mode over 1GB of in-DRAM data. Results shown are the GB/s average of encryption and decryption.
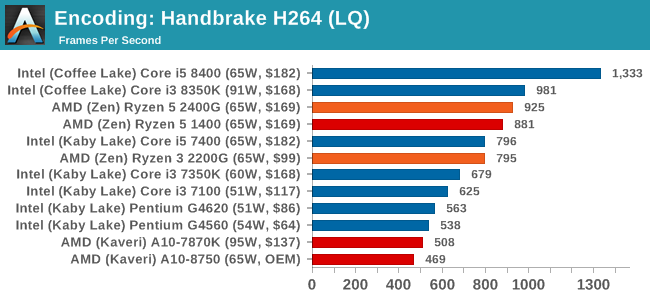
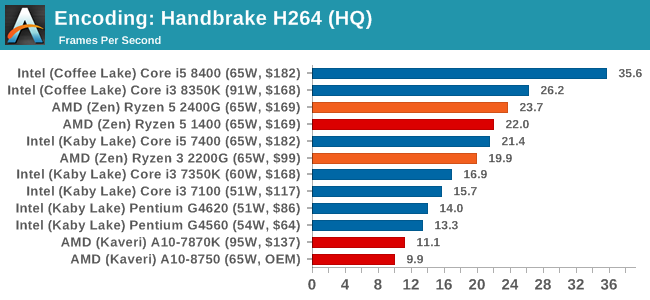
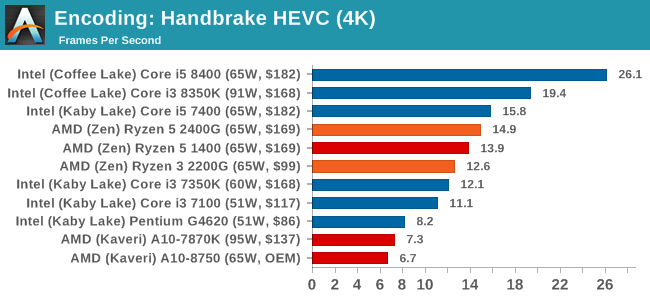
HandBrake v1.0.2 H264 and HEVC: link
As mentioned above, video transcoding (both encode and decode) is a hot topic in performance metrics as more and more content is being created. First consideration is the standard in which the video is encoded, which can be lossless or lossy, trade performance for file-size, trade quality for file-size, or all of the above can increase encoding rates to help accelerate decoding rates. Alongside Google's favorite codec, VP9, there are two others that are taking hold: H264, the older codec, is practically everywhere and is designed to be optimized for 1080p video, and HEVC (or H265) that is aimed to provide the same quality as H264 but at a lower file-size (or better quality for the same size). HEVC is important as 4K is streamed over the air, meaning less bits need to be transferred for the same quality content.
Handbrake is a favored tool for transcoding, and so our test regime takes care of three areas.
Low Quality/Resolution H264: Here we transcode a 640x266 H264 rip of a 2 hour film, and change the encoding from Main profile to High profile, using the very-fast preset.
High Quality/Resolution H264: A similar test, but this time we take a ten-minute double 4K (3840x4320) file running at 60 Hz and transcode from Main to High, using the very-fast preset.
HEVC Test: Using the same video in HQ, we change the resolution and codec of the original video from 4K60 in H264 into 4K60 HEVC.
The office programs we use for benchmarking aren't specific programs per-se, but industry standard tests that hold weight with professionals. The goal of these tests is to use an array of software and techniques that a typical office user might encounter, such as video conferencing, document editing, architectural modelling, and so on and so forth.
All of our benchmark results can also be found in our benchmark engine, Bench.
Chromium Compile (v56)
Our new compilation test uses Windows 10 Pro, VS Community 2015.3 with the Win10 SDK to combile a nightly build of Chromium. We've fixed the test for a build in late March 2017, and we run a fresh full compile in our test. Compilation is the typical example given of a variable threaded workload - some of the compile and linking is linear, whereas other parts are multithreaded.
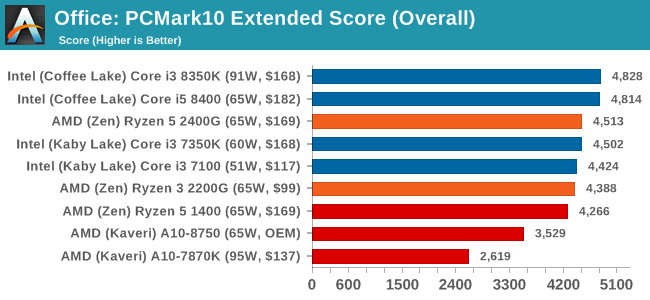
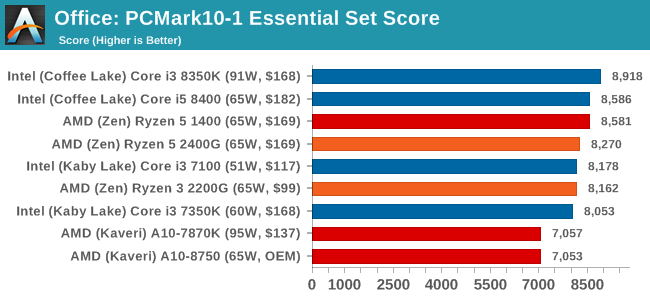
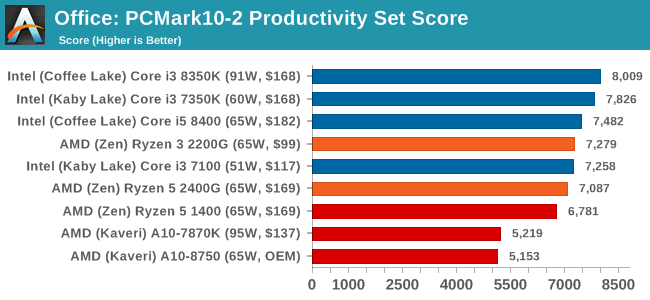
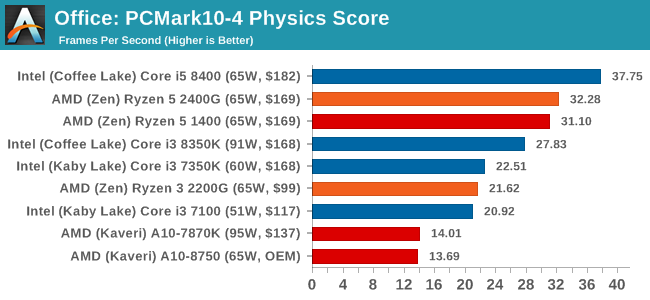
PCMark 10
PCMark 10 is the latest all-in-one office-related performance tool that combines a number of tests for low-to-mid office workloads, including some gaming, but focusing on aspects like document manipulation, response, and video conferencing.
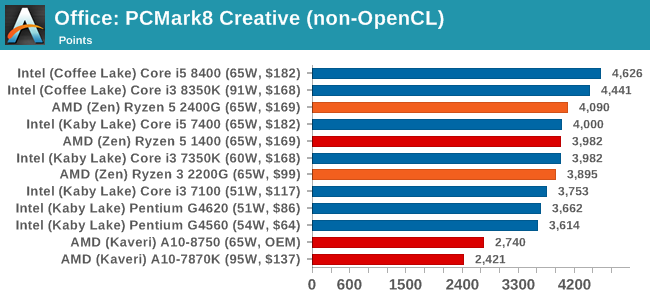
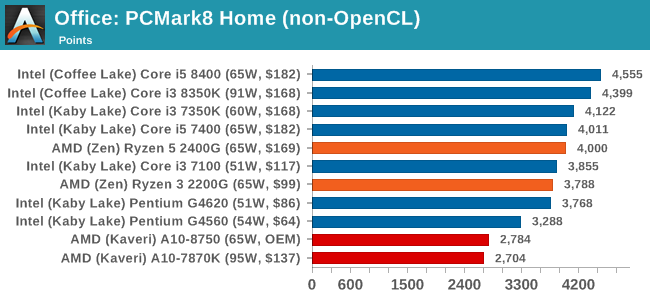
PCMark8: link
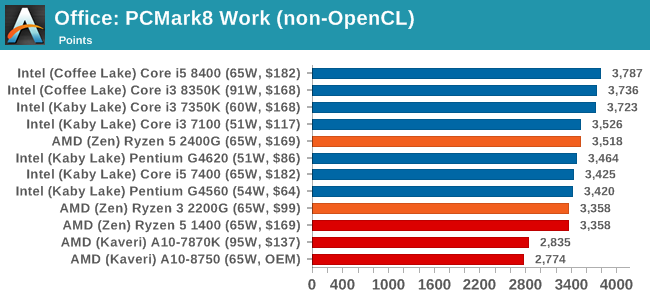
Despite originally coming out in 2008/2009, Futuremark has maintained PCMark8 to remain relevant in 2017. On the scale of complicated tasks, PCMark focuses more on the low-to-mid range of professional workloads, making it a good indicator for what people consider 'office' work. We run the benchmark from the commandline in 'conventional' mode, meaning C++ over OpenCL, to remove the graphics card from the equation and focus purely on the CPU. PCMark8 offers Home, Work and Creative workloads, with some software tests shared and others unique to each benchmark set.
Our legacy tests represent benchmarks that were once at the height of their time. Some of these are industry standard synthetics, and we have data going back over 10 years. All of the data here has been rerun on Windows 10, and we plan to go back several generations of components to see how performance has evolved.
All of our benchmark results can also be found in our benchmark engine, Bench.
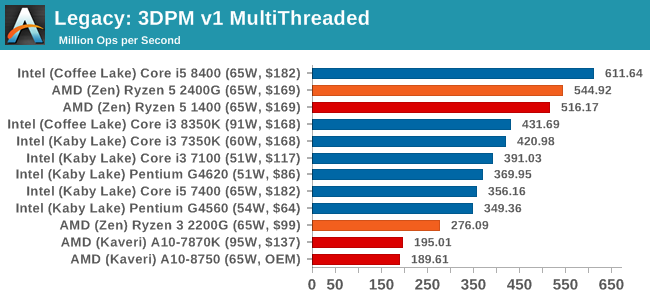
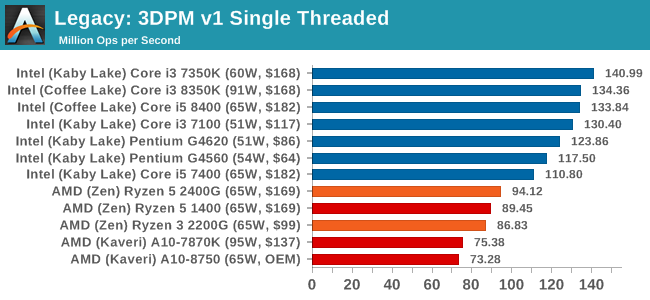
3D Particle Movement v1
3DPM is a self-penned benchmark, taking basic 3D movement algorithms used in Brownian Motion simulations and testing them for speed. High floating point performance, MHz and IPC wins in the single thread version, whereas the multithread version has to handle the threads and loves more cores. This is the original version, written in the style of a typical non-computer science student coding up an algorithm for their theoretical problem, and comes without any non-obvious optimizations not already performed by the compiler, such as false sharing.
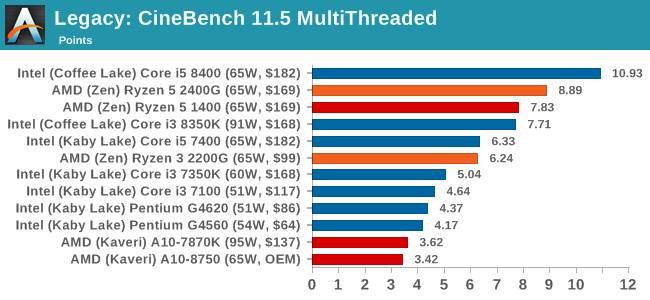
CineBench 11.5 and 10
Cinebench is a widely known benchmarking tool for measuring performance relative to MAXON's animation software Cinema 4D. Cinebench has been optimized over a decade and focuses on purely CPU horsepower, meaning if there is a discrepancy in pure throughput characteristics, Cinebench is likely to show that discrepancy. Arguably other software doesn't make use of all the tools available, so the real world relevance might purely be academic, but given our large database of data for Cinebench it seems difficult to ignore a small five minute test. We run the modern version 15 in this test, as well as the older 11.5 and 10 due to our back data.
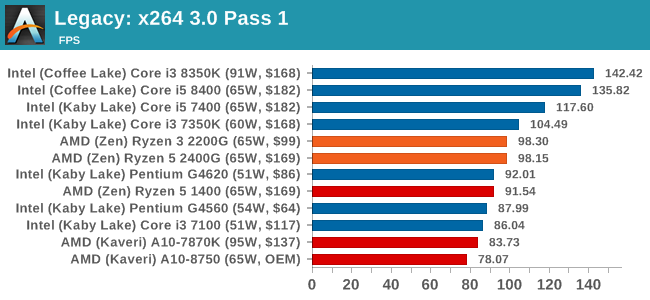
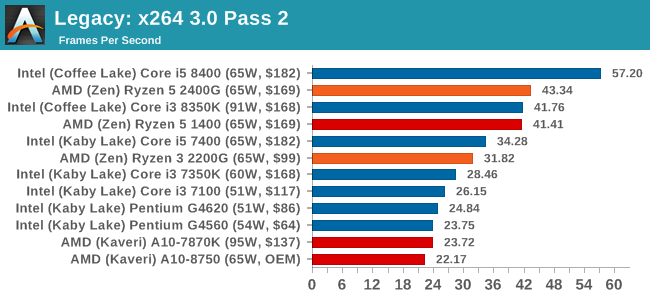
x264 HD 3.0
Similarly, the x264 HD 3.0 package we use here is also kept for historic regressional data. The latest version is 5.0.1, and encodes a 1080p video clip into a high quality x264 file. Version 3.0 only performs the same test on a 720p file, and in most circumstances the software performance hits its limit on high end processors, but still works well for mainstream and low-end. Also, this version only takes a few minutes, whereas the latest can take over 90 minutes to run.
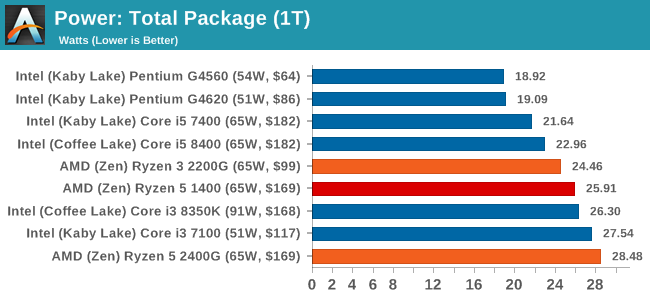
For our power consumption metrics, we use a Prime 95 blend on fixed threads to generate a strong load, and then poll the internal power registers that determine power state calculations to get the power consumption. Each processor is different in how it reports its power, which depends on the level of control the processor has: some of the more advanced CPUs, such as Ryzen, will provide per-core power numbers, while the latest Intel CPUs only give a figure for the CPUs as a whole but also include DRAM controller and uncore power consumption.
An interesting element to the power consumption on the Ryzen APUs, due to the unified power delivery subsystem in play feeding the CPU and the integrated graphics, is that the power registers only report half the power consumption when probed (e.g. when 14W, shows 7W). As of yet, we are unsure if this has a knock-on effect on how the processor adjusts its turbo modes in response to power consumption. Nonetheless, a simple scaling factor gives the following results.
Total Package: The Whole Processor
For this data, we take the values of the processor as a whole, which includes all the interconnect, memory controllers, PCIe root complexes, etc. The system is still only loading the CPU cores with minimal effect on the rest of the system, however depending on how the power is managed, some of the sub-systems still remain enabled.
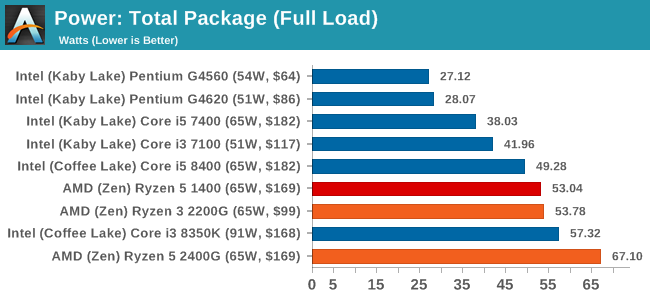
At full load, the difference between the Ryzen 5 and the other Ryzen CPUs shows that the 2400G is using more of its upper margin, compared to the 1400 which is rated at the same power (note TDP is only determined at the base frequency), but the extra frequency of the 2400G means that there is extra power draw overall. Part of this is due to the Infinity Fabric, which we will see below. But what these tests also underline is that in a quad-core configuration, the Intel CPUs are still very power efficient.
Cores Only: Pure Work
For the processors that split out the data, we can look at the power consumption of the cores on their own, without any of the sub-systems, like uncore, mesh, or infinity fabric. This usually paints a different picture to the package power.
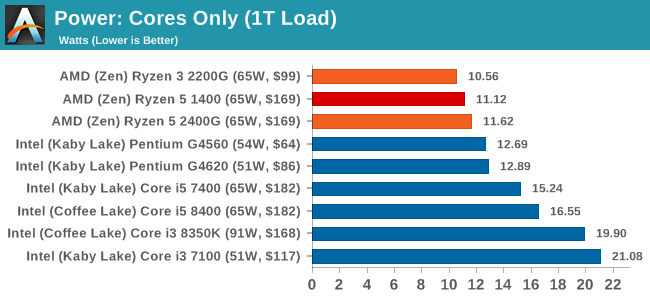
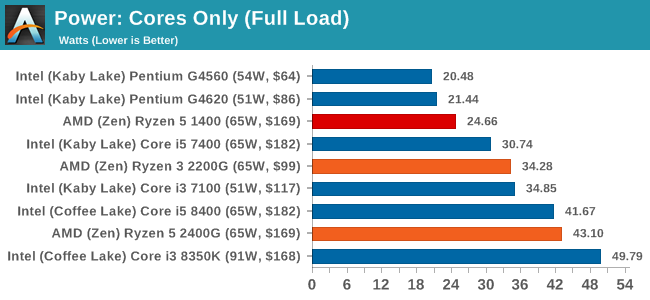
For the core only power, the Ryzen 5 2400G uses less power than the Core i3-8350K, despite the situation being reversed when considering the whole package. This means that Infinity Fabric takes a lot of power here, and the ring bus solution that Intel uses benefits from being simpler, and Intel can push more power to its individual cores.
The march on integrated graphics has come and gone in rapid spurts: the initial goal of providing a solution that provides enough performance for general office work has bifurcated into something that also aims gives a good gaming experience. Despite AMD and NVIDIA being the traditional gaming graphics companies, in this low-end space, it has required companies with x86 CPUs and compatible graphics IP to complete, meaning AMD and Intel. While going toe-to-toe for a number of years, with Intel dedicating over half of its silicon area to graphics at various points, the battle has become one sided - Intel in the end only produced its higher performance solutions for specific customers willing to pay for it, while AMD marched up the performance by offering a lower cost solution as an alternative to discrete graphics cards that served little purpose beyond monitor output devices. This has come to a head, signifying a clear winner: AMD's graphics is the choice for an integrated solution, so much so that Intel is buying AMD's Vega silicon, a custom version, for its own mid-range integrated graphics. For AMD, that's a win. Now with the new Ryzen APUs, AMD has rizen that low-end bar again.
If there was any doubt that AMD holds the integrated graphics crown, when we compare the new Ryzen APUs against Intel's latest graphics solutions, there is a clear winner. For almost all the 1080p benchmarks, the Ryzen APUs are 2-3x better in every metric. We can conclude that ntel has effectively given over this integrated graphics space to AMD at this point, deciding to focus on its encode/decode engines rather than raw gaming and 3D performance. With AMD having DDR4-2933 as the supported memory frequency on the APUs, assuming memory can be found for a reasonable price, it gaming performance at this price is nicely impressive.
When we compare the Ryzen 5 2400G with any CPU paired with the NVIDIA GT 1030, both solutions are within a few percent of each other in all of our 1080p benchmarks. The NVIDIA GT 1030 is a $90 graphics card, which when paired with a CPU, gets you two options: either match the combined price with the Ryzen 5 2400G, which leaves $80 for a CPU, giving a Pentium that loses in anything multi-threaded to AMD; or just increases the cost fo the system to get a CPU that is equivalent in performance. Except for chipset IO, the Intel + GT 1030 route offers no benefits over the AMD solution: it costs more, for a budget-constrained market, and draws more power overall. There's also the fact that the AMD APUs come with a Wraith Stealth 65W cooler, which adds additional value to the package that Intel doesn't seem to want to match.
For the compute benchmarks, Intel is still a clear winner with single threaded tests, with a higher IPC and higher turbo frequency. That is something that AMD might be able to catch up with on 12nm Zen+ coming later this year, which should offer a higher frequency, but Zen 2 is going to be the next chance to bridge this gap. If we compare the multi-threaded tests, AMD with 4C/8T and Intel 6C/6T seem to battle it out depending if a test can use multi-threading appropriately, but compared to Kaby Lake 4C/4T or 2C/4T offerings, AMD comes out ahead.
With the Ryzen 5 2400G, AMD has completely shut down the sub-$100 graphics card market. As a choice for gamers on a budget, those building systems in the region of $500, it becomes the processor to pick.
For the Ryzen 3 2200G, we want to spend more time analyzing the effect of a $99 quad-core APU the market, as well as looking how memory speed effects performance, especially with integrated graphics. There's also the angle of overclocking - with AMD showing a 20-25% frequency increase on the integrated graphics, we want to delve into how to unlock potential bottlenecks in a future article.